
Using simulation software to improve micro mobility mechanics
Urban transportation is changing very fast. You can see how the city around you is constantly in development. And it’s not just the revolution of electric cars. Electric bikes, scooters, and other micro-mobility vehicles transform how we navigate cities. This shift towards cleaner, more efficient travel is very important for sustainable urban living. However, one key challenge holds back widespread adoption: efficient battery charging.
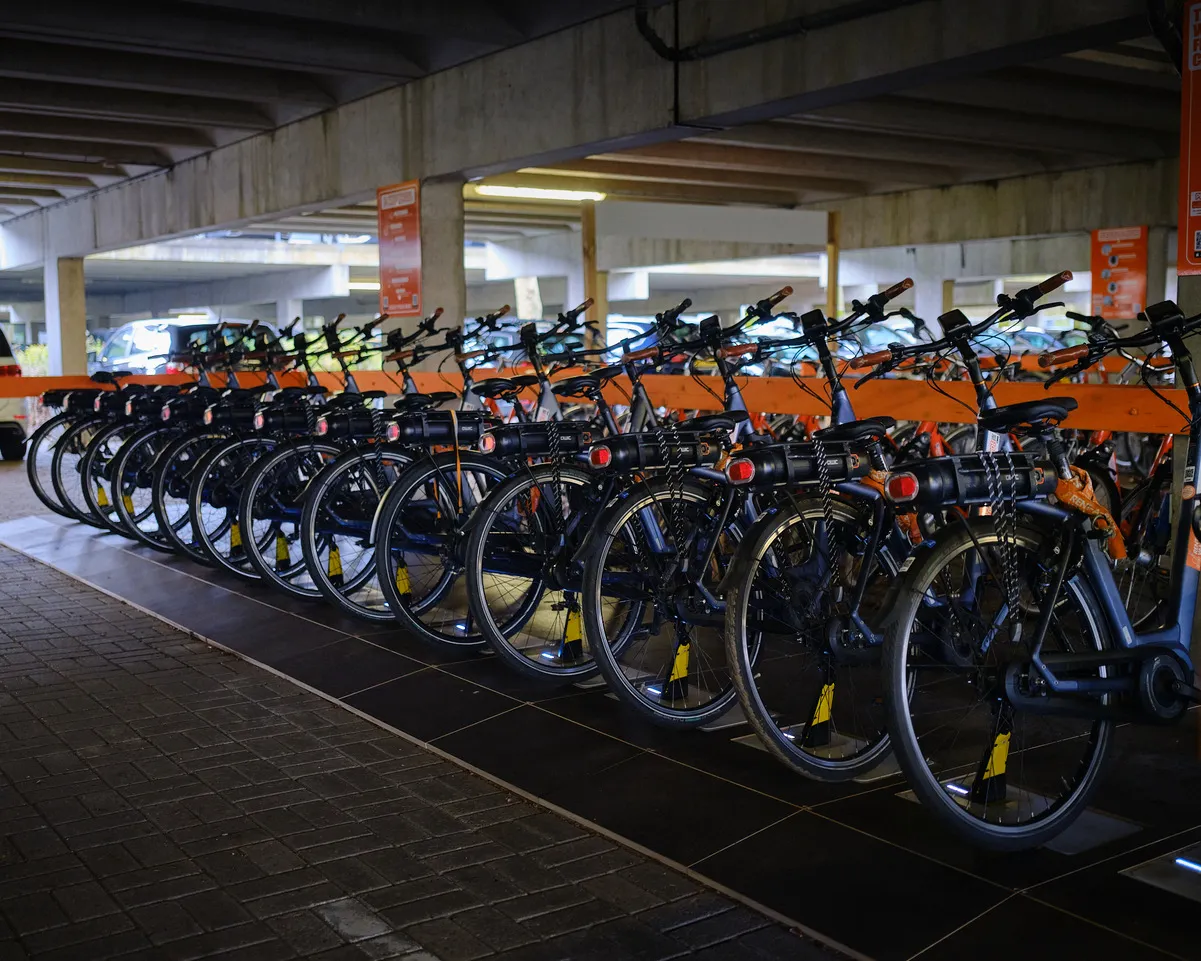
Traditional charging methods are slow, costly, and labor-intensive, often requiring manual battery swapping and centralized charging hubs. If you drive an electric bike or a scooter, you’ve probably seen how empty batteries are collected and charged in some warehouses where batteries are plugged for charging. This type of traditional way is becoming outdated. Engineers and manufacturers need a solution that keeps up with the rapid growth of micro-mobility fleets.
The solution is wireless charging. Imagine how all the electric transportation is charged while they are parked in a designated area, or even charged while using it. But it’s not only about the right solution in the lab. The solution also has to fit the city environment and be easily built.

In this particula case study we wanted to explore the challenges of wireless charging (WCH) for micro-mobility vehicles and how simulation software provides the answer. We’ve had recently a talk with Tiler company CTO Joris Koudijs, and we were really inspired to write this case study and make a simulation of our own.
You’ll learn how companies like Tiler are using simulation to overcome alignment issues, optimize charging efficiency, and reduce costs.
If you’re an engineer or manufacturer looking to innovate your wireless charging solutions, this case study offers practical insights, examples, and possible results to help you stay ahead in the evolving urban transport market.
What is the challenge?
Urban transportation is undergoing a silent revolution. But it’s not that silent anymore, because you can see it happening around you. More people are choosing electric bicycles, scooters, and other micro-mobility solutions to navigate cities efficiently, hoping to skip those endless traffic jams and non-existent parking spaces.
But there’s a hitch – battery recharging is inefficient and labor-intensive. There has to be another solution. And this is what many companies are designing right now. A better way to charge batteries with less hassle.
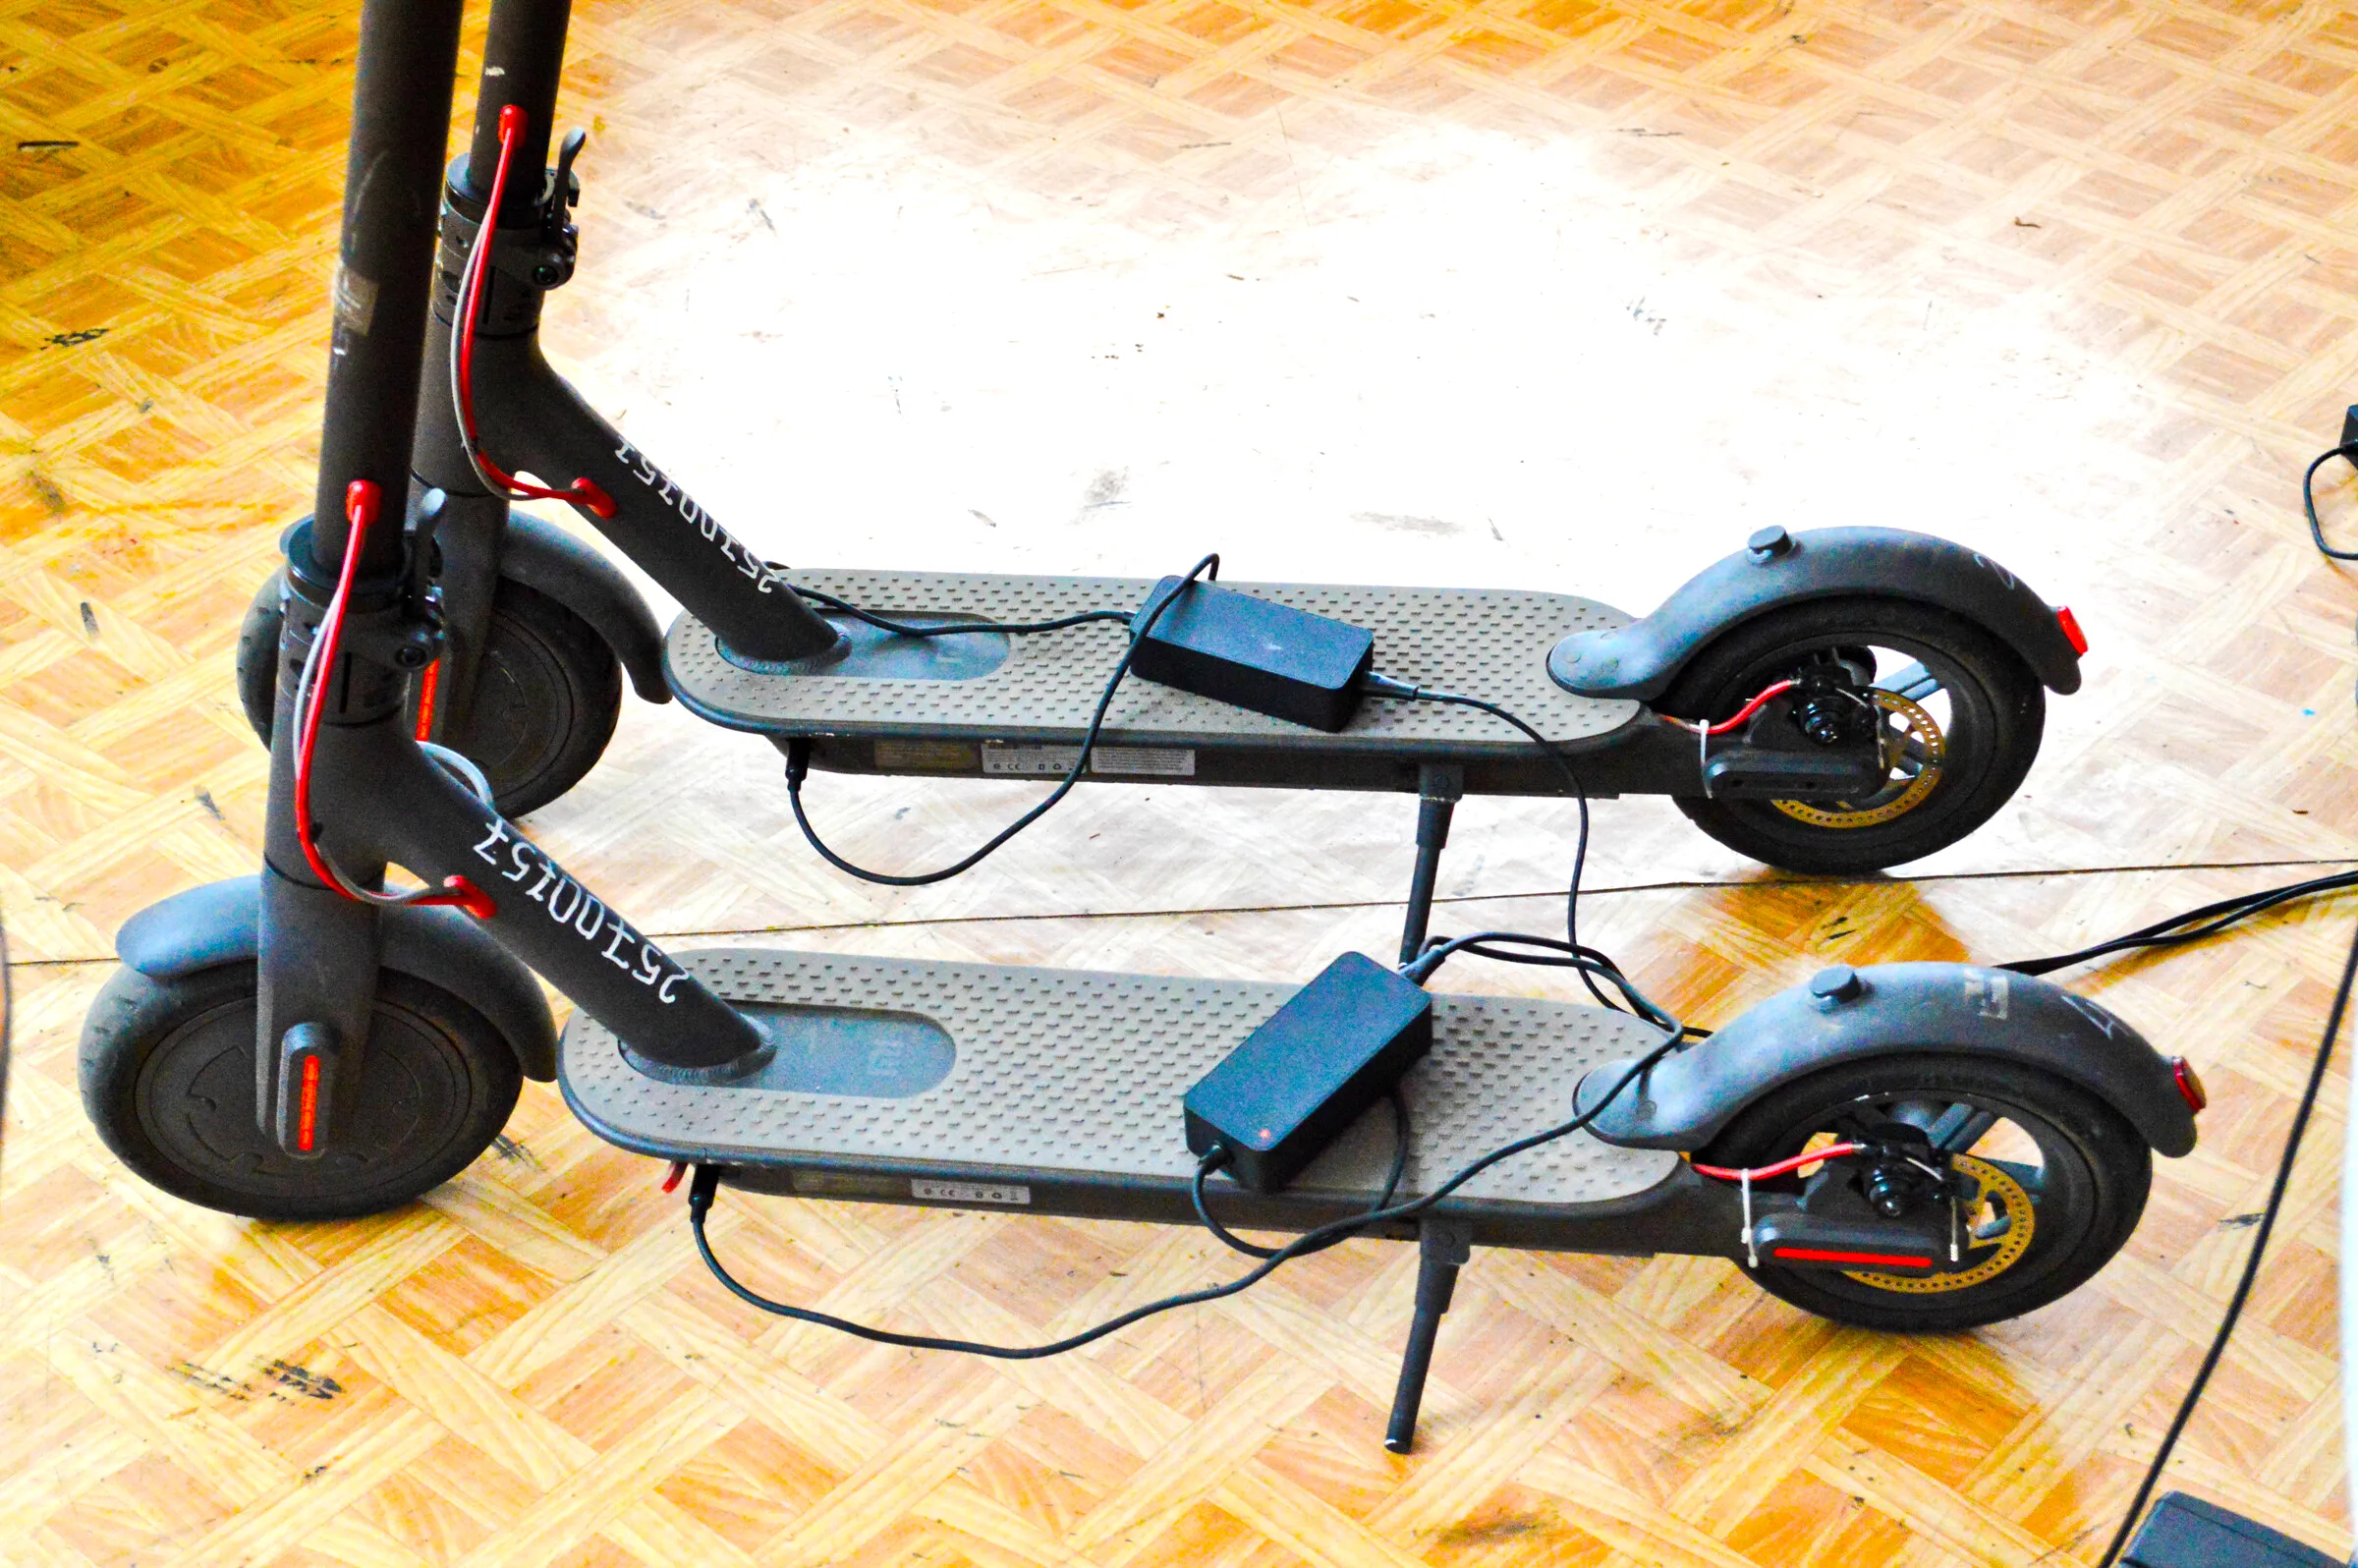
This photo demonstrates how batteries are charged with a charging cable.
Just to draw you a picture, how does it work right now. Currently, workers manually collect depleted batteries, transport them to warehouses for recharging, and return them to vehicles. This process is costly, time-consuming, and unsustainable for growing fleets.
Companies like Tiler, a Dutch pioneer in urban wireless charging, recognize that the future lies in seamless Wireless Charging (WCH) solutions integrated directly into parking infrastructure.
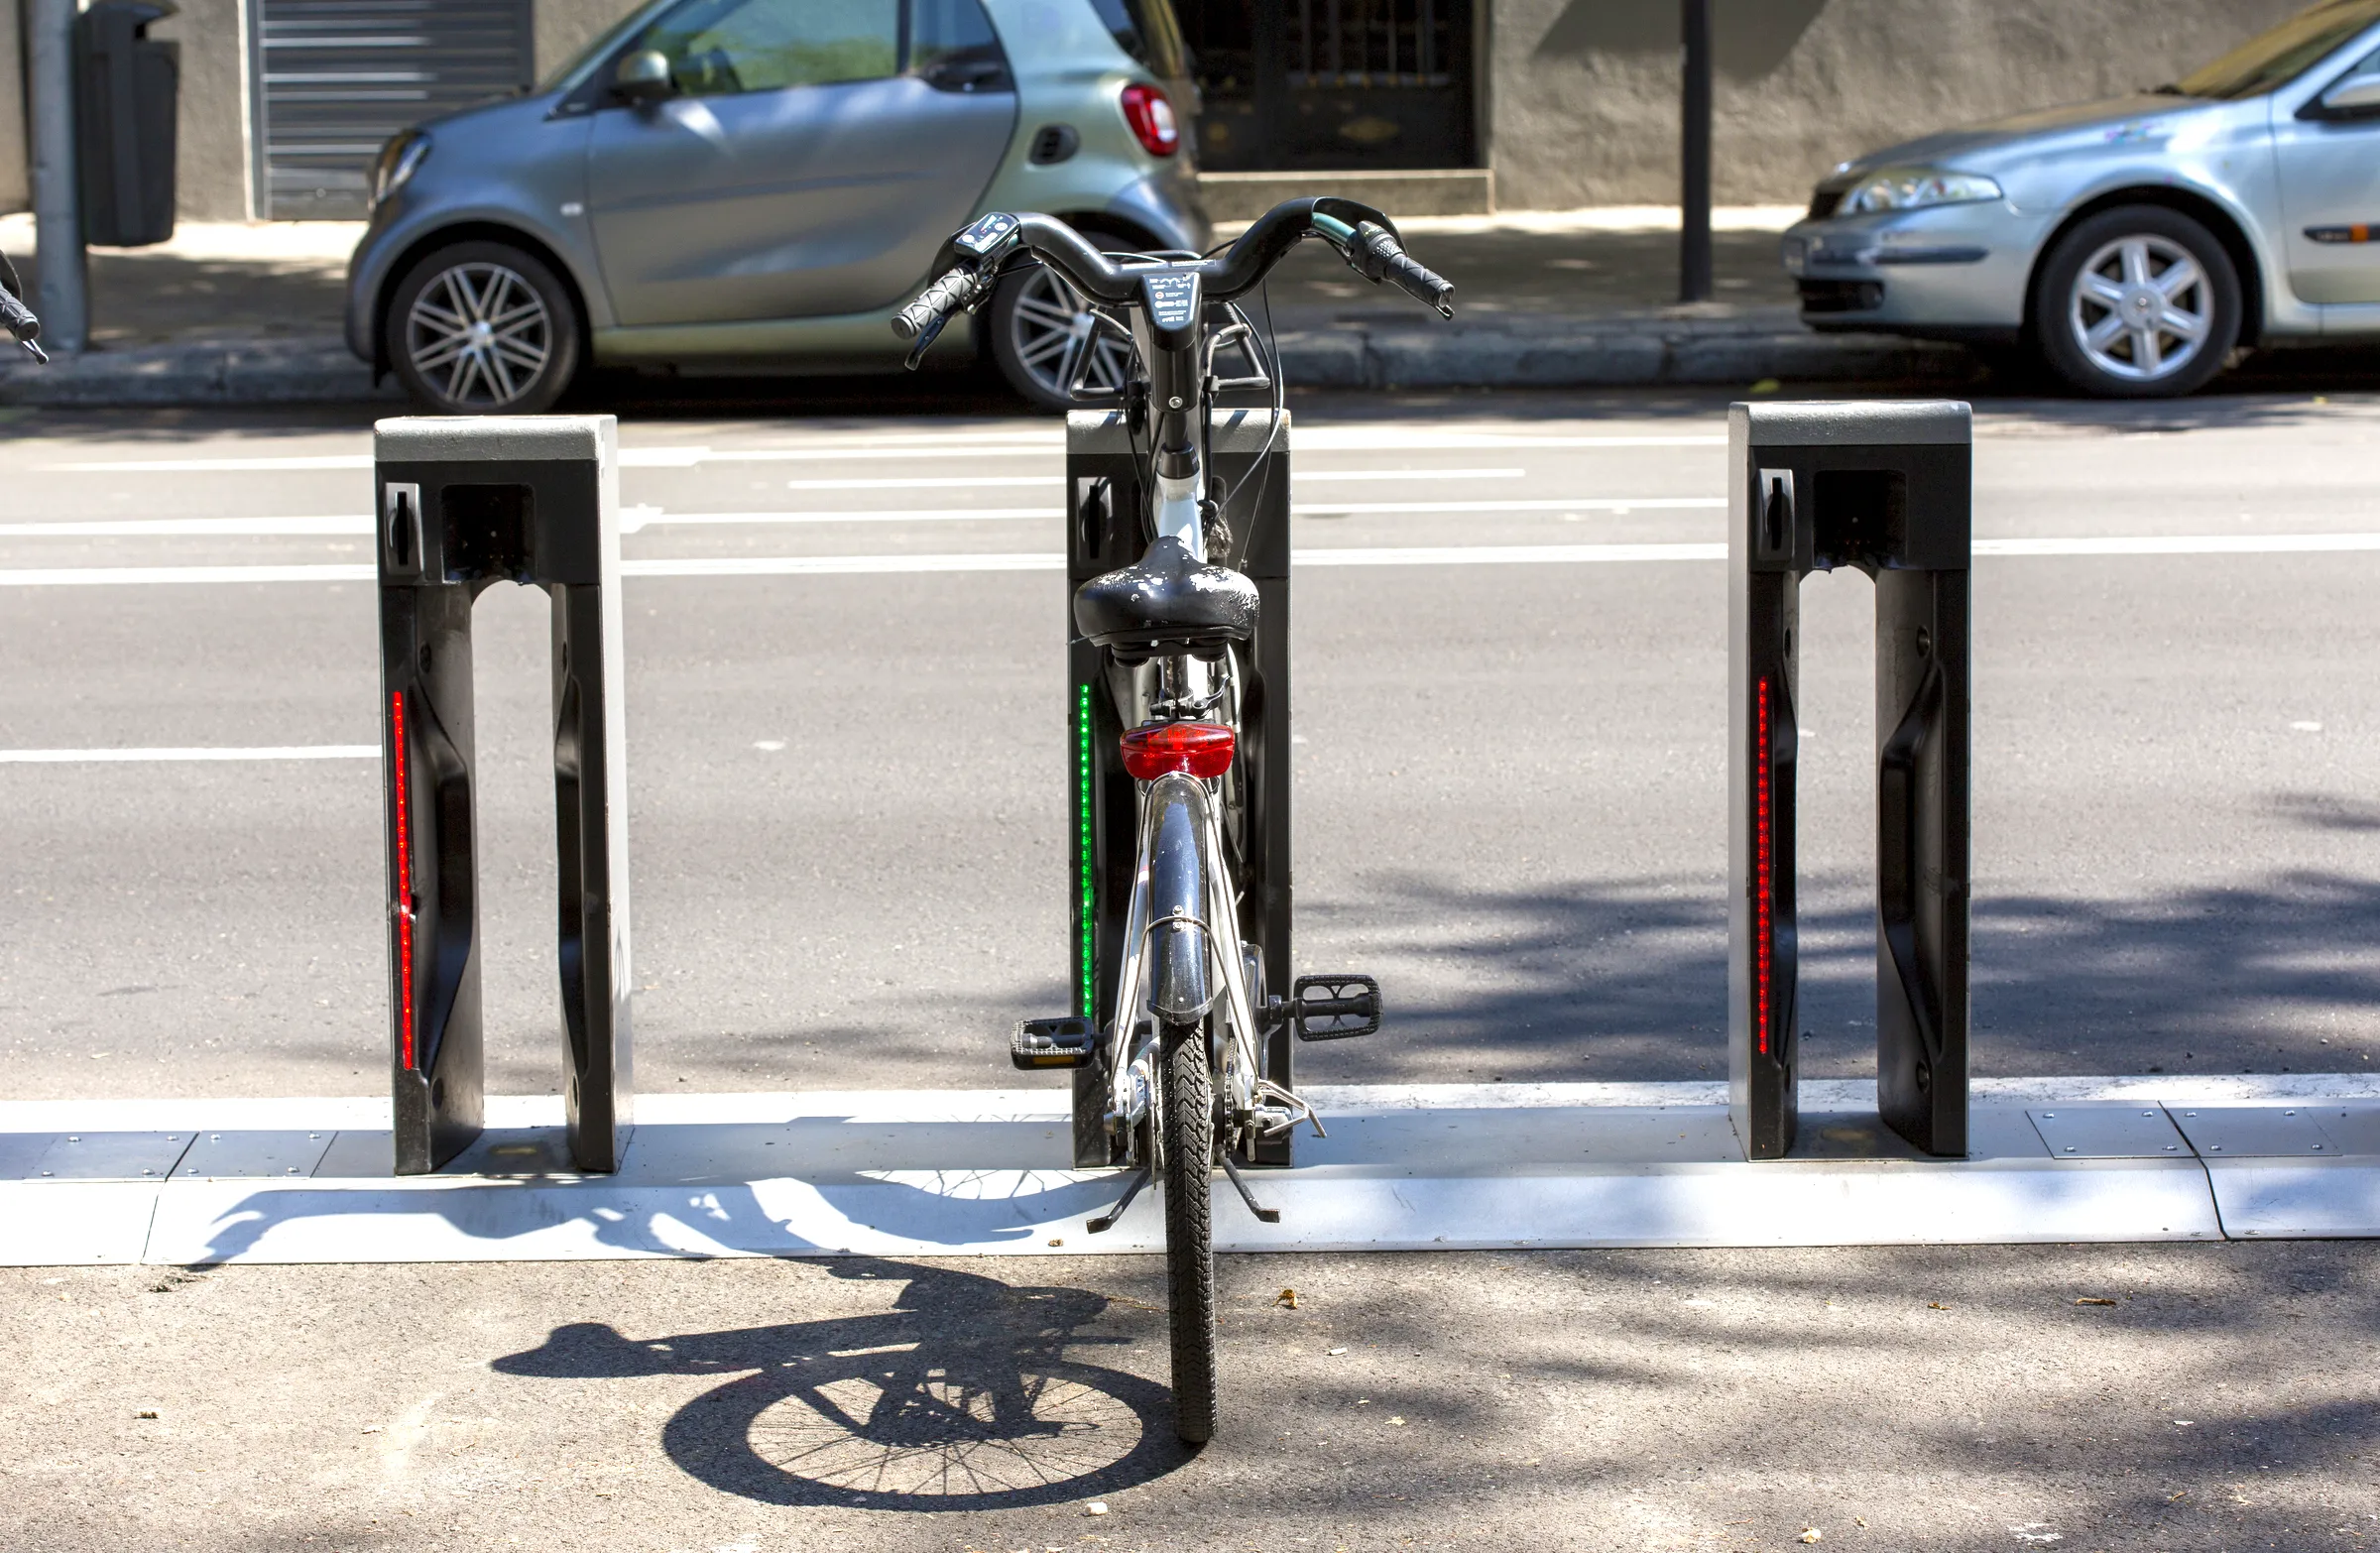
This is one example how electric bicycle is charged in a designated post.
However, designing effective wireless chargers for micro-mobility comes with different kinds of challenges, and there are many of those. Here are few:
- Alignment issues: Precise coil alignment between the charger and vehicle is quite important. Even slight misalignments reduces efficiency.
- Design complexity: Space constraints in e-bikes and scooters limit coil placement options.
- Efficiency optimization: Ensuring fast, consistent charging without energy loss is technically demanding.
Engineers must design, test, and optimize these systems rapidly and cost-effectively. Traditional prototyping methods simply can’t keep up with the speed of innovation required today.
What is the solution?
This is where simulation software changes the business.
Simulation allows engineers to:
- Visualize and test coil alignment: Misalignment issues can be identified and corrected virtually, ensuring efficient charging even when vehicles are not perfectly docked.
- Optimize coil placement: Engineers can simulate different placements within limited spaces and choose designs that maximize charging efficiency.
- Save time and costs: Instead of weeks of physical prototyping, simulation provides answers in seconds.
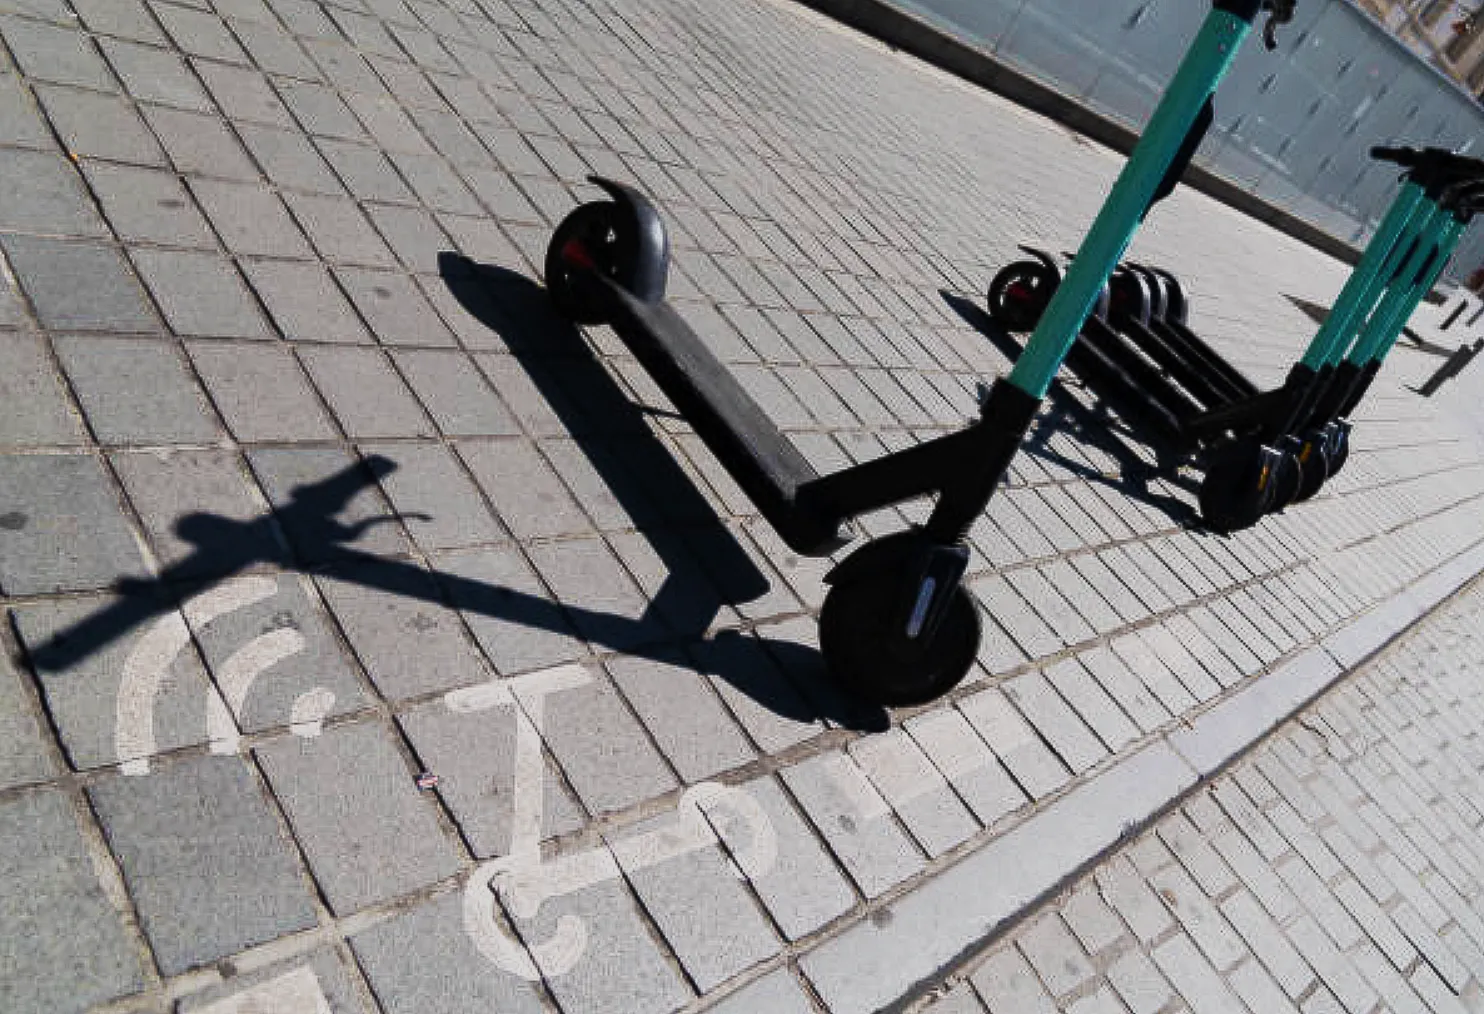
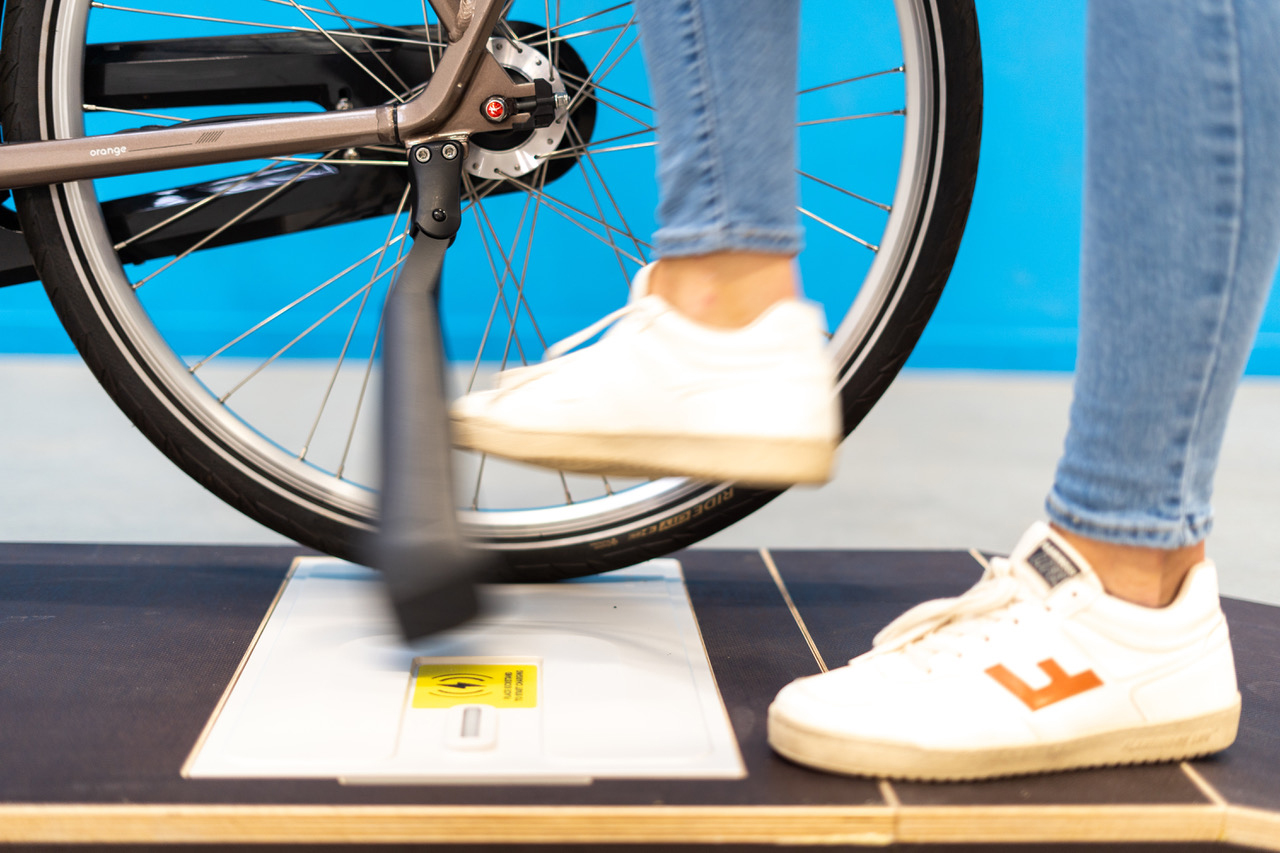
Imagine you park the scooter to a designated post, and it will recharge while standing.
Companies like Tiler have successfully applied simulation to their wireless charging designs. Their goal is to embed chargers seamlessly into parking areas – imagine a charging plate on the ground where scooters or bikes rest, or a charger integrated into the vehicle stand itself.
Here’s the feedback from Tiler CTO Joris Koudijs (https://www.tilercharge.com):
Tiler explored multiple simulation tools, but found CENOS to be the most user friendly by far. It is really quick to setup multiple studies and iterate the design quickly. We also simulated the designs we have in production already and found very good correlation.
Simulation supported Tiler to improve their designs efficiently, addressing misalignment challenges and ensuring their charging solutions perform flawlessly in real-world conditions. There is still a lot of work to do, and using simulation software can help simulate different iterations of various ideas.
Tiler has managed to overcome the misalignment challenges with their coil design. They achieved an average K of 0.5 and Q of 700+ over a displacement of 3x the size of the receiver.
Tiler uses the vehicle kickstand as the receiver and a pavement tile as the transmitter. This puts an additional requirement for high misalignment performance.
Let’s look at the following images of the Tiler wireless charging solution.
A simplified simulation overview
Let’s look at the simplified wireless charging simulation using CENOS : WCH simulation software, demonstrating a rather simple interaction between a charger coil (transmitter) and a receiver coil (on the vehicle). It is a very close idea of how any charging spot could be solved for electric bicycles, scooters or other in an urban environment.
Simulation control setup
This setup controls the general simulation parameters for wireless charging.

Key parameters and their significance
Symmetry:
The full 3D model option accounts for all possible orientations and complexities, providing the most accurate simulation for real-world charging scenarios. Engineers can analyze the entire charging interaction without assumptions about symmetry.
Time:
Transient analysis helps engineers understand how the electromagnetic field evolves over time, crucial for evaluating dynamic charging conditions.
- Frequency: 12,000 Hz is typical for wireless power transfer systems, balancing efficiency and practicality.
- End time: 4 seconds
- Calculation time step: 0.25 seconds
Adaptive time steps allow for fine-tuning computational accuracy without excessive simulation times.
- Computation algorithm: The default algorithm optimizes performance for general use cases. Engineers can modify this for specialized simulations if needed.
- LTspice circuit simulation (unchecked): This option allows integrating circuit-level simulations. Leaving it unchecked simplifies the setup for purely electromagnetic field analysis.
The simulation shows the electromagnetic field distribution during the charging process, illustrating key design elements and potential challenges for wireless charging in urban environments.
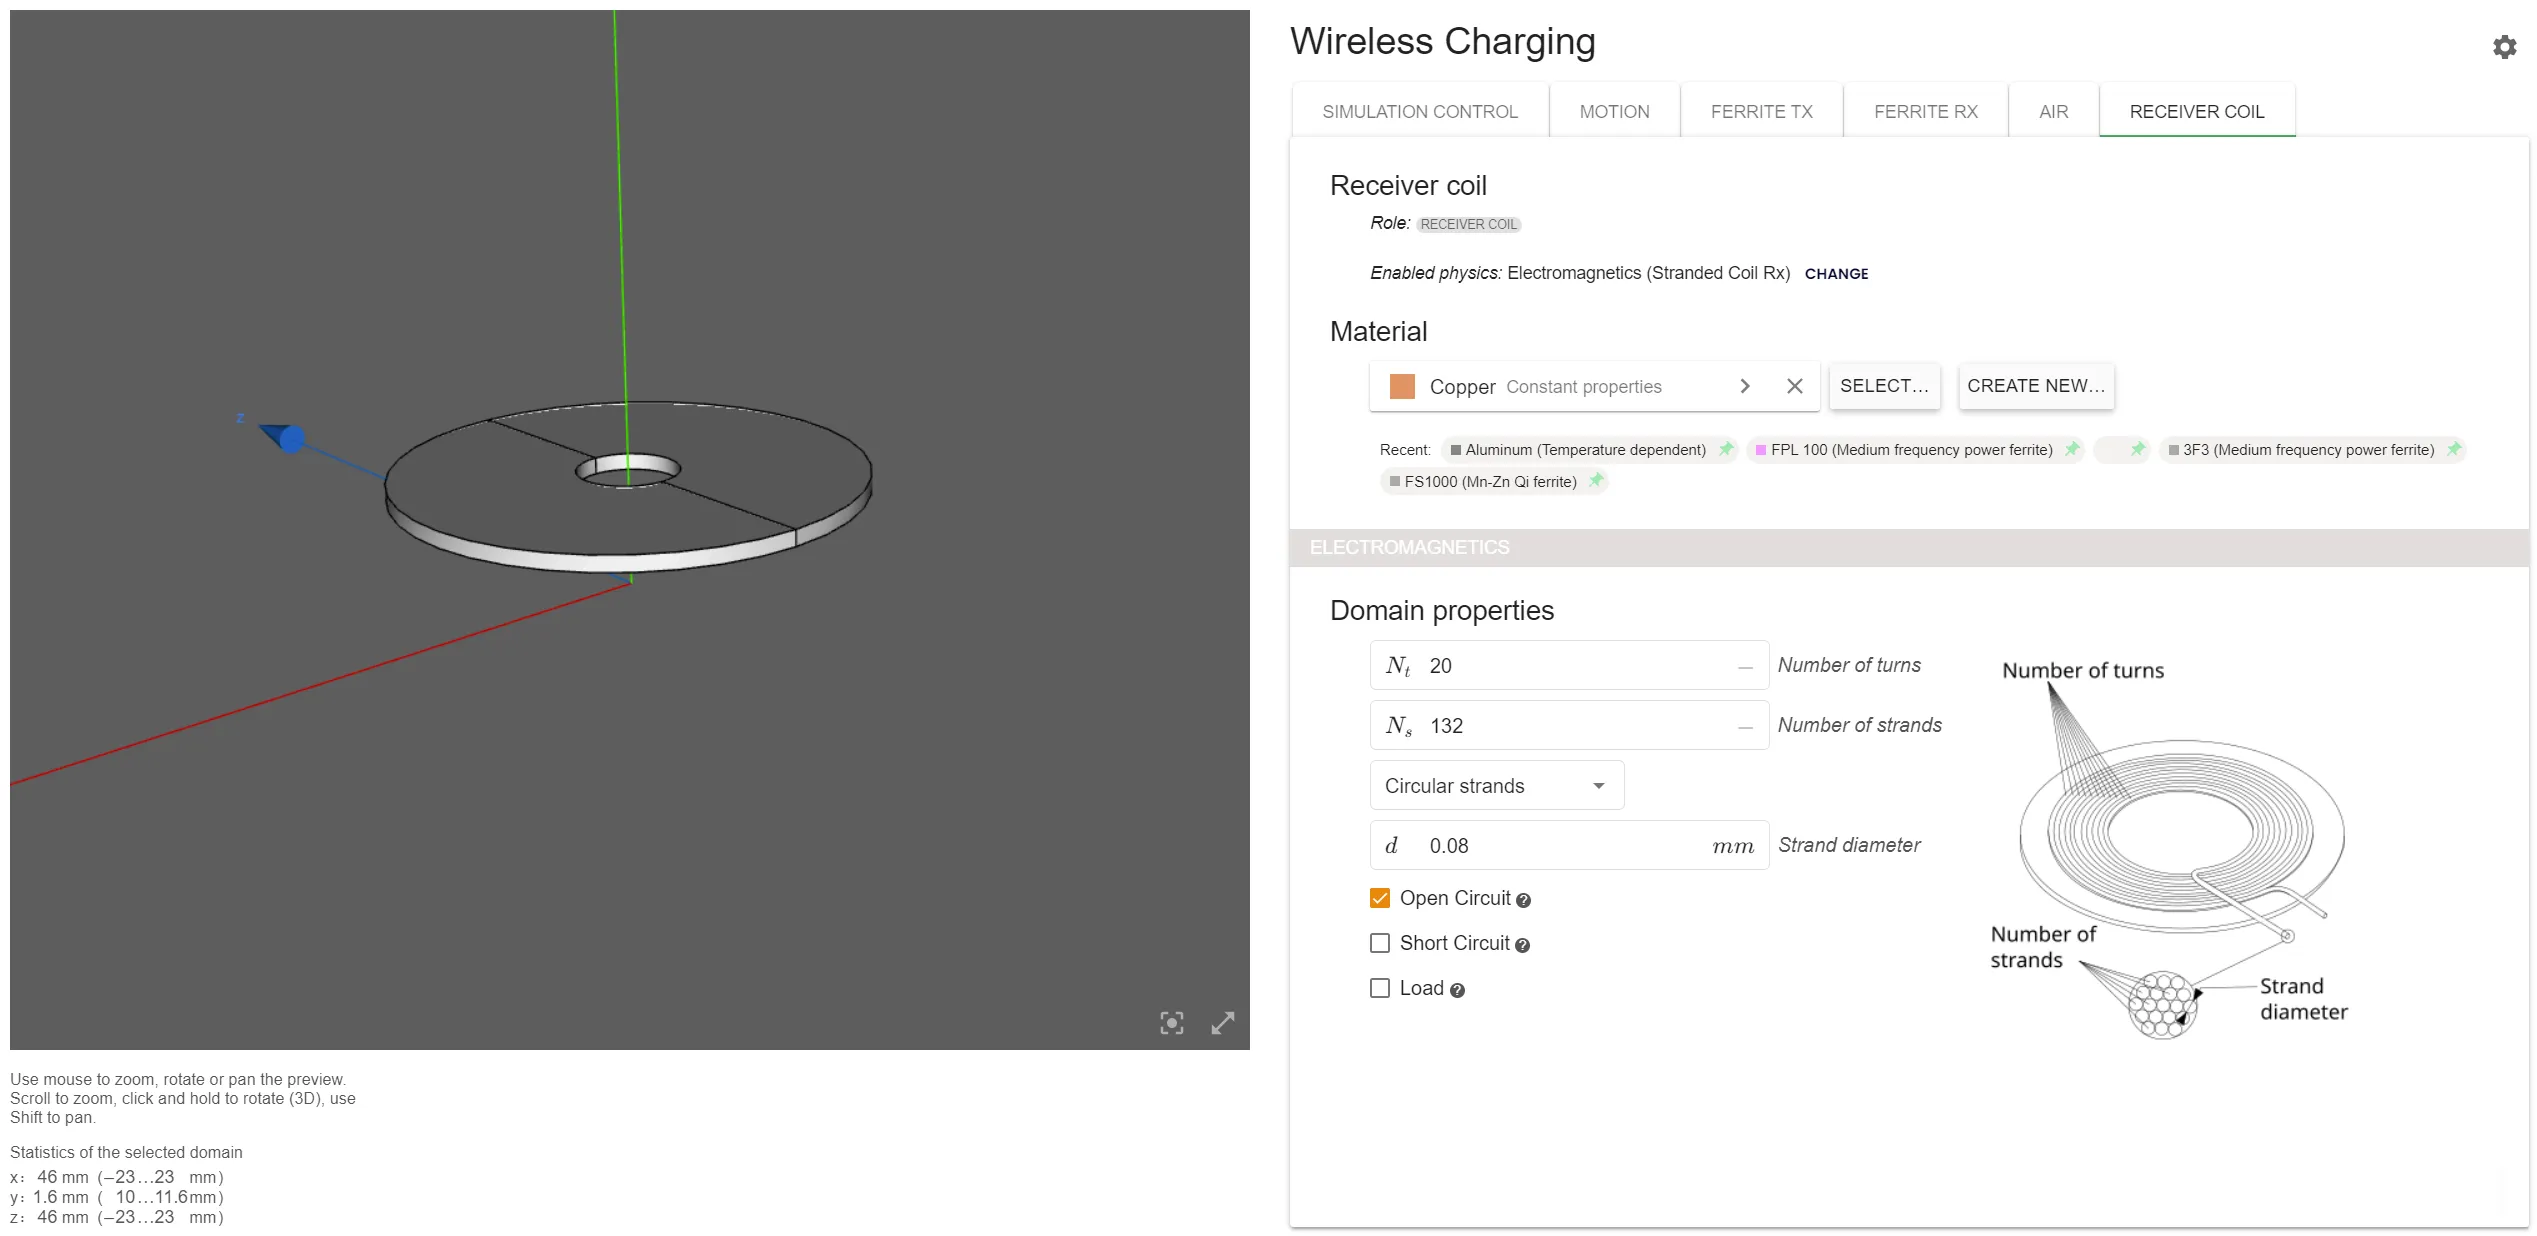
Receiver coil setup
This image focuses on configuring the receiver coil for the simulation.
Key parameters and their significance
Material:
- Copper is the standard material for receiver coils due to its high electrical conductivity, which minimizes energy losses during wireless power transfer.
Electromagnetic domain properties:
- Number of turns (NtN_tNt): 20. More turns increase the coil’s inductance, improving energy transfer efficiency but potentially increasing size and resistance.
- Number of strands (NsN_sNs): 132. Multi-strand wires reduce the skin effect, which is critical at higher frequencies, ensuring more efficient current distribution.
- Strand diameter (ddd): 0.08 mm. Thin strands (0.08 mm) help mitigate losses due to skin effect, enhancing efficiency for high-frequency applications.
- Strand configuration: Circular strands.
Circuit options:
- Open circuit (checked): The simulation models the receiver coil as an open circuit to evaluate the coil’s electromagnetic behavior without load constraints.
There are a lot of benefits of using simulation software for product development. Engineers can validate design choices such as coil geometry, materials, and operating frequencies before prototyping, saving time and resources.
By adjusting parameters like frequency, number of turns, and strand diameter, engineers can strike a balance between efficiency, size, and cost.
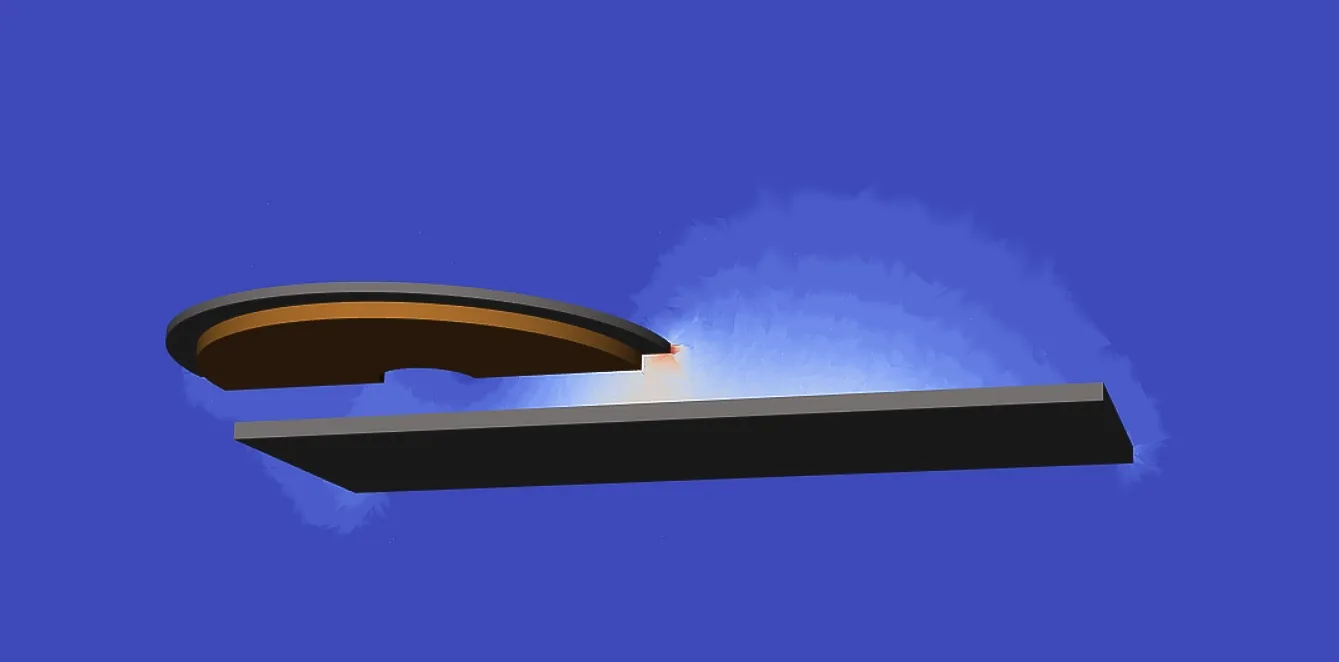
What can we learn from the simulation?
Electromagnetic field distribution
- The image visualizes the electromagnetic field emitted by the charger coil. The red areas indicate high-intensity zones where the magnetic coupling is strongest, while the blue areas show diminishing intensity. Engineers can analyze these field distributions to make sure that there is efficient energy transfer from the charger to the receiver coil.

Coil alignment impact
- The visual highlights the importance of coil alignment for efficient charging. Even minor misalignments can result in energy losses or reduced charging efficiency. By simulating various alignment scenarios, engineers can design systems that maintain effective charging despite imperfect positioning.
Charging placement flexibility
This setup can be adapted for different charging locations, such as:
- Ground-level charging pads for scooters and bikes.
- Wall-mounted chargers for compact parking solutions.
- Charging posts integrated into urban infrastructure.
Material and design optimization
- The simulation allows product developers to test different materials and geometric configurations to achieve maximum efficiency and minimal energy loss before physical prototyping.
What engineers, product developers, and manufacturers can learn?
Optimizing coil design
- The different coil structures shown in these simulations demonstrate the importance of selecting the right coil geometry for specific use cases. Engineers can simulate and compare designs to determine which structure best suits their product’s application.
Designing for misalignment tolerance
- The broader field distribution in the second simulation suggests a design that can tolerate slight misalignments. This is crucial in real-world urban environments where perfect docking alignment is not always possible.
Performance across air gaps
- By analyzing simulations with varying air gaps, engineers can optimize the distance between charger and receiver coils to balance performance and practicality.
Reducing physical prototypes
- Simulation provides a cost-effective way to refine designs before physical prototyping. By visualizing electromagnetic interactions, developers can make informed decisions on coil placement, structure, and alignment.
What is the result?
The shift to wireless charging for micro-mobility isn’t just convenient – it’s transformative. For engineers and manufacturers, streamlined WCH means:
- Reduced operational costs: No more manual battery swaps.
- Scalable solutions: As urban fleets expand, wireless charging scales effortlessly.
- Better user experience: Riders simply park their vehicles, and charging happens automatically.
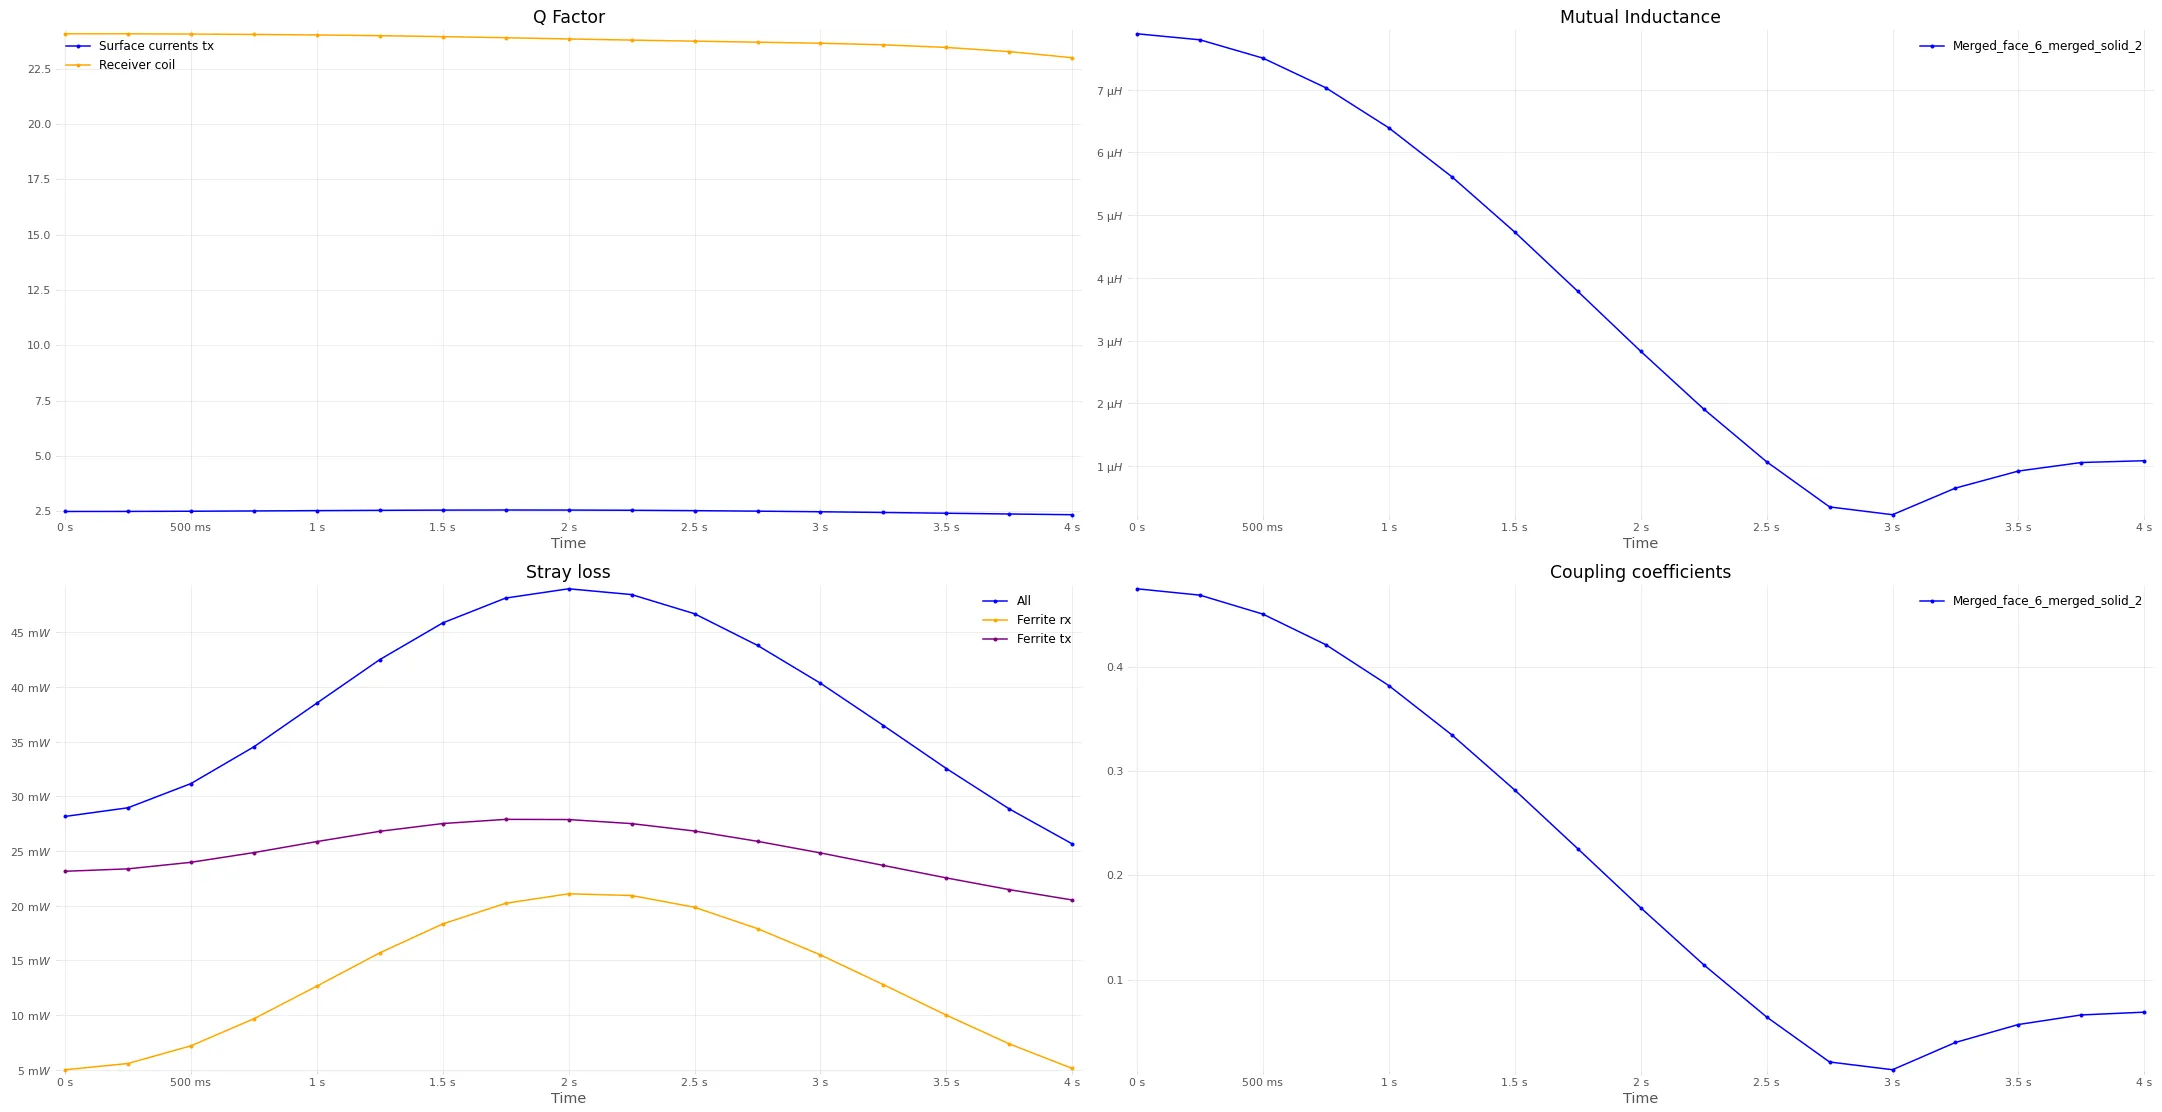
For this particular simulation case study, let’s analyze the graphs that simulation software provides. This graph provides four key graphs from a wireless charging simulation using CENOS Wireless Charging (CENOS : WCH) simulation software. The graphs illustrate critical parameters over a 4-second simulation period:
1. Q Factor (top left graph)
- The Q Factor (Quality Factor) indicates how efficiently the coils can store energy versus losing it to resistance.
- A high Q Factor for the receiver coil means it efficiently stores and transfers energy with minimal loss.
- The low Q Factor for the transmitter could suggest potential inefficiencies in energy delivery or high resistive losses.
Takeaway for engineers:
- Focus on optimizing the transmitter coil design to reduce resistive losses and improve the Q Factor.
- Make sure the receiver coil maintains its high Q Factor by using materials with low resistivity and optimizing geometry.
2. Mutual inductance (top right graph)
- Mutual inductance starts at around 7 µH and steadily decreases, reaching a low of ~1 µH at the 3-second mark before slightly recovering.
- Mutual inductance measures the efficiency of magnetic coupling between the transmitter and receiver coils.
- The decreasing mutual inductance suggests that the coils are moving out of alignment during the simulation, which reduces energy transfer efficiency.
Takeaway for engineers:
- Ensure precise alignment between the coils in real-world designs to maintain high mutual inductance.
- Design the system to tolerate misalignment by optimizing coil shape and placement.
3. Stray loss (bottom left graph)
- Stray loss increases initially, peaking at ~45 mW for the “All” category (total system) around the 2-second mark and then decreases.
- The Ferrite RX (receiver ferrite) and Ferrite TX (transmitter ferrite) contribute less to stray losses compared to the total.
Takeaway for Engineers:
- Minimize stray losses by optimizing the ferrite materials and ensuring tighter magnetic field containment.
- Address misalignment issues to reduce leakage fields during charging.
4. Coupling coefficient (bottom right graph)
- The coupling coefficient starts at ~0.45 and drops significantly to ~0.05 by the 3-second mark before slightly recovering.
- The coupling coefficient measures the efficiency of magnetic linkage between the coils (0 = no coupling, 1 = perfect coupling).
- The sharp decline indicates a loss of alignment or increased distance between the coils, reducing energy transfer efficiency.
Takeaway for engineers:
- Ensure designs maintain a high coupling coefficient by keeping coils in close proximity and well-aligned.
- Use designs that can tolerate misalignment to avoid drastic drops in efficiency.
Cities are evolving. Efficient wireless charging solutions for e-bikes, scooters, and other micro-mobility vehicles are key to supporting greener, smarter urban transport.
Companies like Tiler are at the forefront of this shift, and simulation is their secret weapon. Engineers who use simulation in their development process will solve today’s challenges easier and stay ahead in the race to shape the cities of tomorrow.
