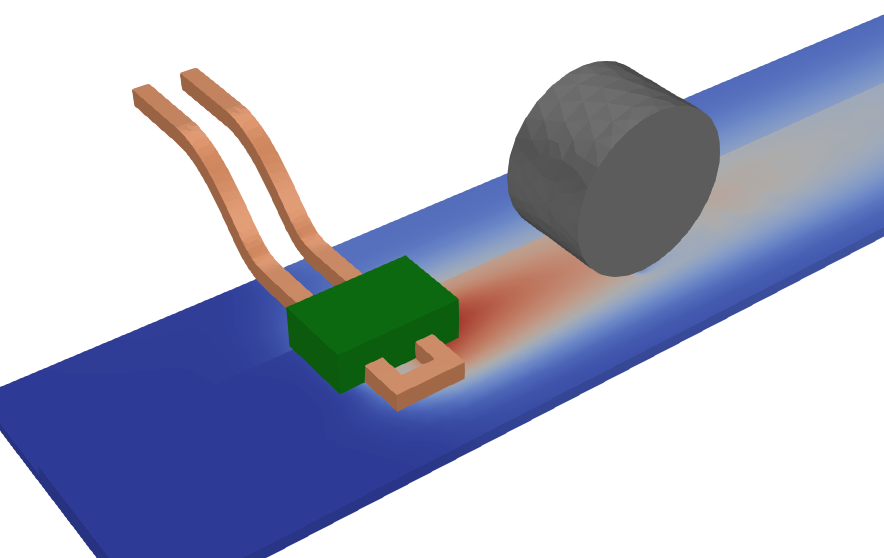
Thermoplastic welding – two CFRP pieces with consolidation roller thermal effects
This image represents a simulation of an induction welding process between two Carbon Fiber Reinforced Polymer (CFRP) components. Here’s a detailed breakdown of what is happening and what insights can be drawn from the simulation:
Process overview
- Induction heating:
- The copper coil (visible in the image) generates an electromagnetic field when alternating current flows through it.
- This field induces eddy currents in the conductive layers of the CFRP pieces. These currents generate heat due to the material’s electrical resistance, enabling the welding process.
- Consolidation roller:
- A consolidation roller (the cylindrical component shown in the simulation) applies mechanical pressure at the weld zone.
- This pressure ensures intimate contact between the two CFRP pieces, consolidating the molten resin at the interface and forming a solid bond upon cooling.
- Thermal effects:
- The color gradient in the image represents the temperature distribution within the materials and surrounding components.
- The red zone indicates areas of higher temperature, where the heat is sufficient to melt the resin in the CFRP.
- The blue zones signify cooler areas, providing insight into how heat dissipates across the materials.
Key observations from the simulation
- Heat distribution:
- The simulation shows a localized heating effect near the inductor coil and along the weld line.
- Effective heat localization is crucial for preventing damage to the bulk material and ensuring efficient energy use.
- Thermal influence of the roller:
- The thermal interaction between the roller and the weld zone is also modeled. This shows how the roller might affect the cooling rate and uniformity of the welded joint.
- Potential weak spots:
- Areas with uneven heating or insufficient pressure could result in weak bonds. By analyzing the thermal map, engineers can optimize coil placement, power levels, and roller pressure to improve weld quality.
- Design optimization:
- The simulation allows engineers to test different coil configurations, power levels, or roller designs to achieve uniform heating and reliable welds without the need for physical prototypes.
- Material behavior:
- The temperature profile also provides insights into the behavior of the resin matrix in the CFRP during the welding process. This includes melt flow, curing dynamics, and potential areas for void formation.
Applications of the simulation
- Process Optimization: Engineers can use this simulation to refine induction welding parameters, such as power input, coil geometry, or roller pressure, to achieve optimal results.
- Defect Prevention: By analyzing temperature gradients, this simulation helps predict and mitigate defects like uneven bonding, material degradation, or voids.
- Validation and Quality Assurance: The results from the simulation can be validated against experimental results, ensuring the reliability of the welding process.
Practical takeaways
This simulation exemplifies how advanced engineering tools enable precise control over complex processes like induction welding. It allows engineers to:
- Visualize and adjust critical variables before practical implementation.
- Ensure robust and high-quality joints between CFRP components.
- Reduce trial-and-error in real-world manufacturing, saving time and resources.
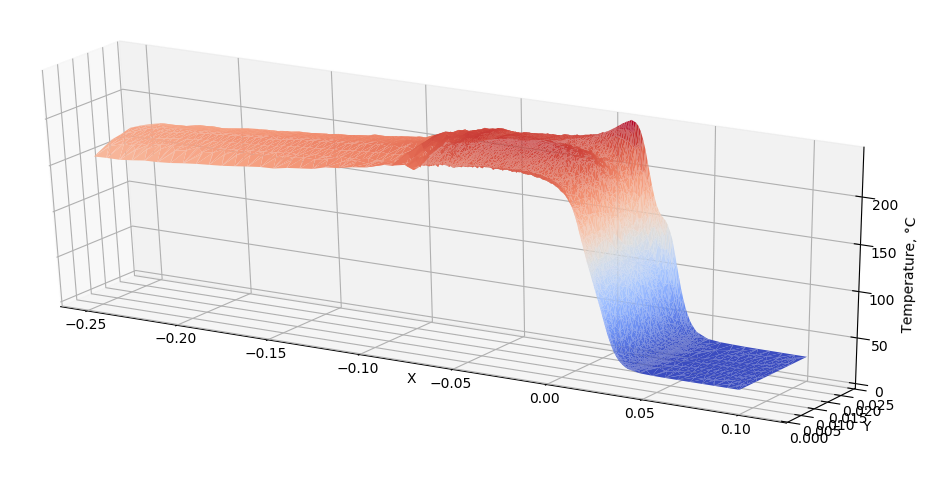
The chart is a 3D surface plot that visualizes temperature distribution during a process such as induction welding or heating. Here’s a detailed analysis of the chart and the insights it provides:
Key observations from the chart
- Axes information:
- The X-axis and Y-axis represent spatial coordinates (distance in a 2D plane) along the material or simulation domain.
- The Z-axis represents the temperature (in °C) across the domain.
- Temperature profile:
- The red region corresponds to high-temperature zones, likely near the heat source or the area directly affected by induction heating.
- The blue region represents cooler zones, where heat has dissipated away from the source or where cooling mechanisms are more effective.
- Temperature gradient:
- The steep drop from red to blue indicates a sharp temperature gradient. This shows that the heating effect is highly localized and diminishes rapidly with distance.
- Such gradients are characteristic of precise heating processes like induction, where heat is concentrated in specific zones.
- Heat localization:
- The plot suggests that the heating process is well-contained within the desired region, minimizing thermal effects on surrounding areas. This is important for preventing damage to sensitive materials and ensuring efficient energy use.
- Cooling influence:
- The slope and extent of the blue region indicate how effectively heat dissipates through conduction, convection, or other mechanisms. A longer slope might suggest slower cooling, while a sharp drop-off indicates rapid cooling.
What this chart reveals
- Process efficiency:
- The well-defined red region suggests efficient heat delivery to the target zone, which is critical in applications like induction welding.
- Thermal management:
- The smooth gradient from red to blue demonstrates controlled heat dissipation, which is key to avoiding thermal stress or material degradation.
- Potential issues:
- If the gradient were uneven or irregular, it could indicate issues like material inconsistency, uneven heating, or suboptimal setup.
- Process optimization:
- Engineers can use this data to adjust parameters like coil position, power levels, or cooling mechanisms to achieve the desired temperature distribution.
Applications of this analysis
- Quality assurance: The temperature profile can help ensure uniform heating and bonding in processes like welding or curing.
- Simulation validation: Comparing this chart with experimental results validates the accuracy of the simulation and its applicability to real-world scenarios.
- Process design: Insights from this chart guide decisions on power input, cooling design, and material selection to optimize manufacturing processes.
This visualization effectively captures the thermal behavior of the system, providing valuable information for improving and controlling the induction heating or welding process.
