How INLAN tested 10 boards and found CENOS simulation matched hardware results
A 10-board test showed that CENOS matched the measured resonance very closely across nine valid boards, giving INLAN a stronger basis for early design decisions before the next hardware step.
In RF design, simulation is not there to make nice images. It is there to help engineers decide what to do next. That is what makes this particular test useful.
INLAN tested 10 fabricated f0 boards and compared the measured results with simulation outputs from CENOS, COMSOL, and ADS. One board was defective, so the final comparison used nine valid boards.
This is important because one board can be an exception. Nine valid boards show whether the result holds across real hardware.
Across those nine boards, the measured resonance at minimum S11 clustered around 894.78 MHz. The CENOS simulation curve reached its minimum at 893.47 MHz, only 1.31 MHz away from the measured mean. For a team making design decisions before the next hardware step, that is not just a nice match. It is the kind of result that helps reduce uncertainty early.
In other words, the point of this particular test is not that simulation produced a curve that looked convincing. The point is that it tracked fabricated hardware so closely to support the design process in a meaningful way.
“What stood out to us was how closely the CENOS simulation aligned with the measured board performance. That level of consistency is important because it helps us evaluate designs earlier and move into physical testing with more confidence.”
— INLAN team
Why this test is important
In RF design, resonance location is one of the first things engineers need to get right. If the resonance lands far away from the target region, the design direction may need to change before it makes sense to fine-tune anything else.
The measured boards did not collapse into one identical response. Their minimum frequencies spanned 891.65 MHz to 898.25 MHz, with a sample spread of ±2.26 MHz around the mean. That is exactly the sort of variation engineers expect when boards move from design files to manufactured hardware.
In this particular test, CENOS did land almost exactly the same result.
What was tested
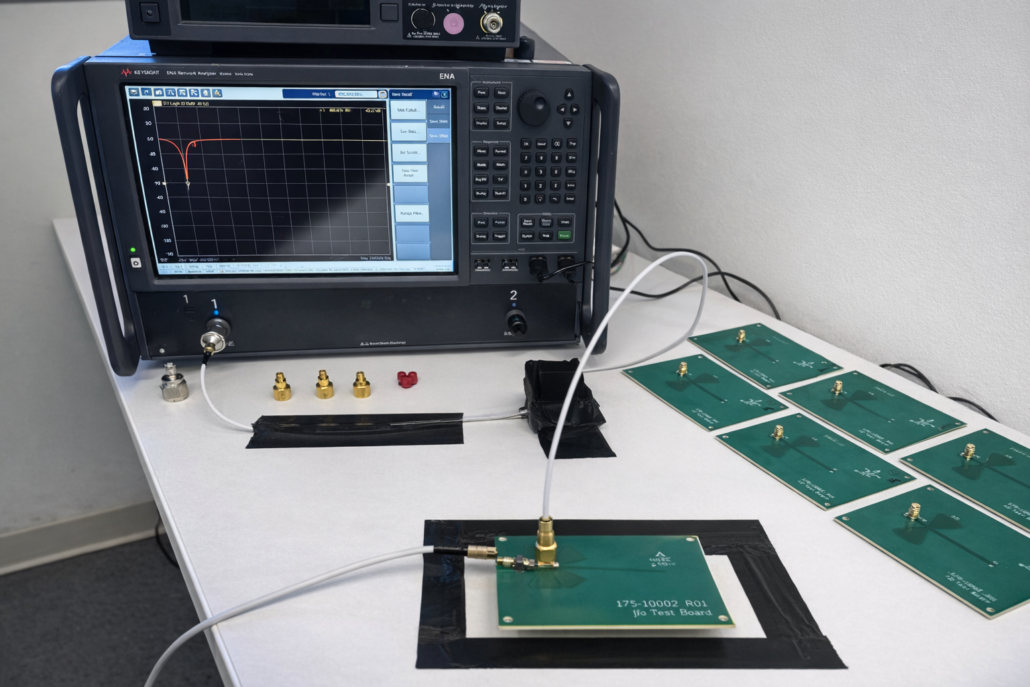
INLAN measured the f0 board with a 50-ohm input port and a 1.4 pF capacitor in series with 8.2 ohms. The test setup used Megatron 7(N) board material, an E5080B network analyzer, and an 8552D calibration kit. Calibration was performed at the end of the cable, and the board was placed on spacers during measurement.
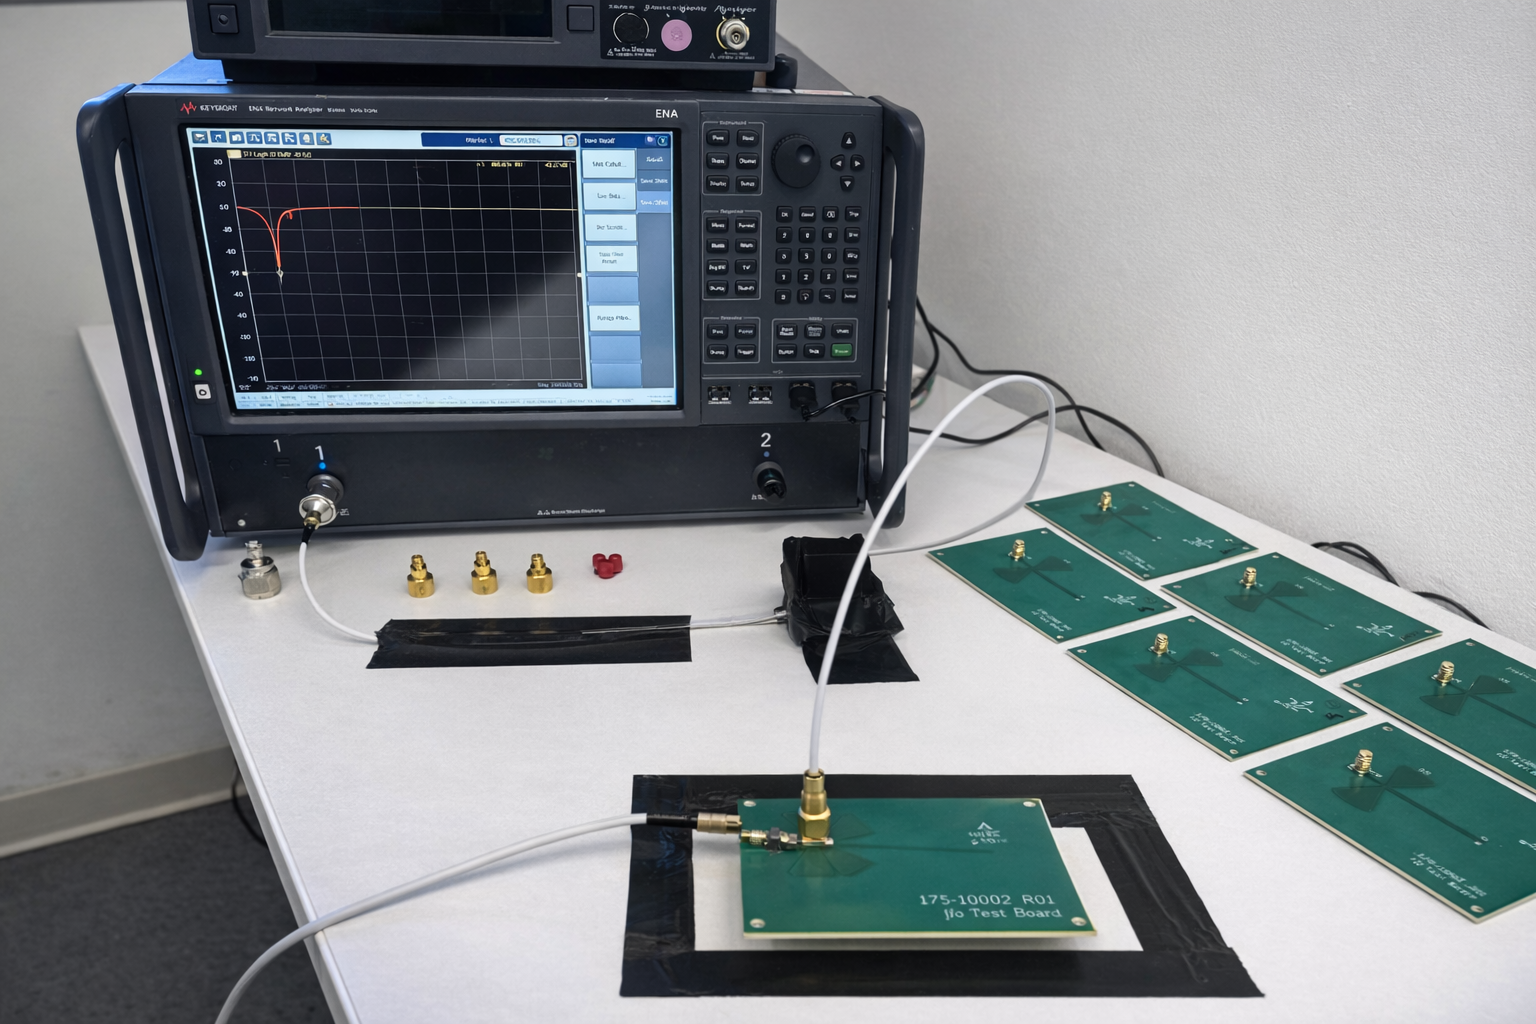
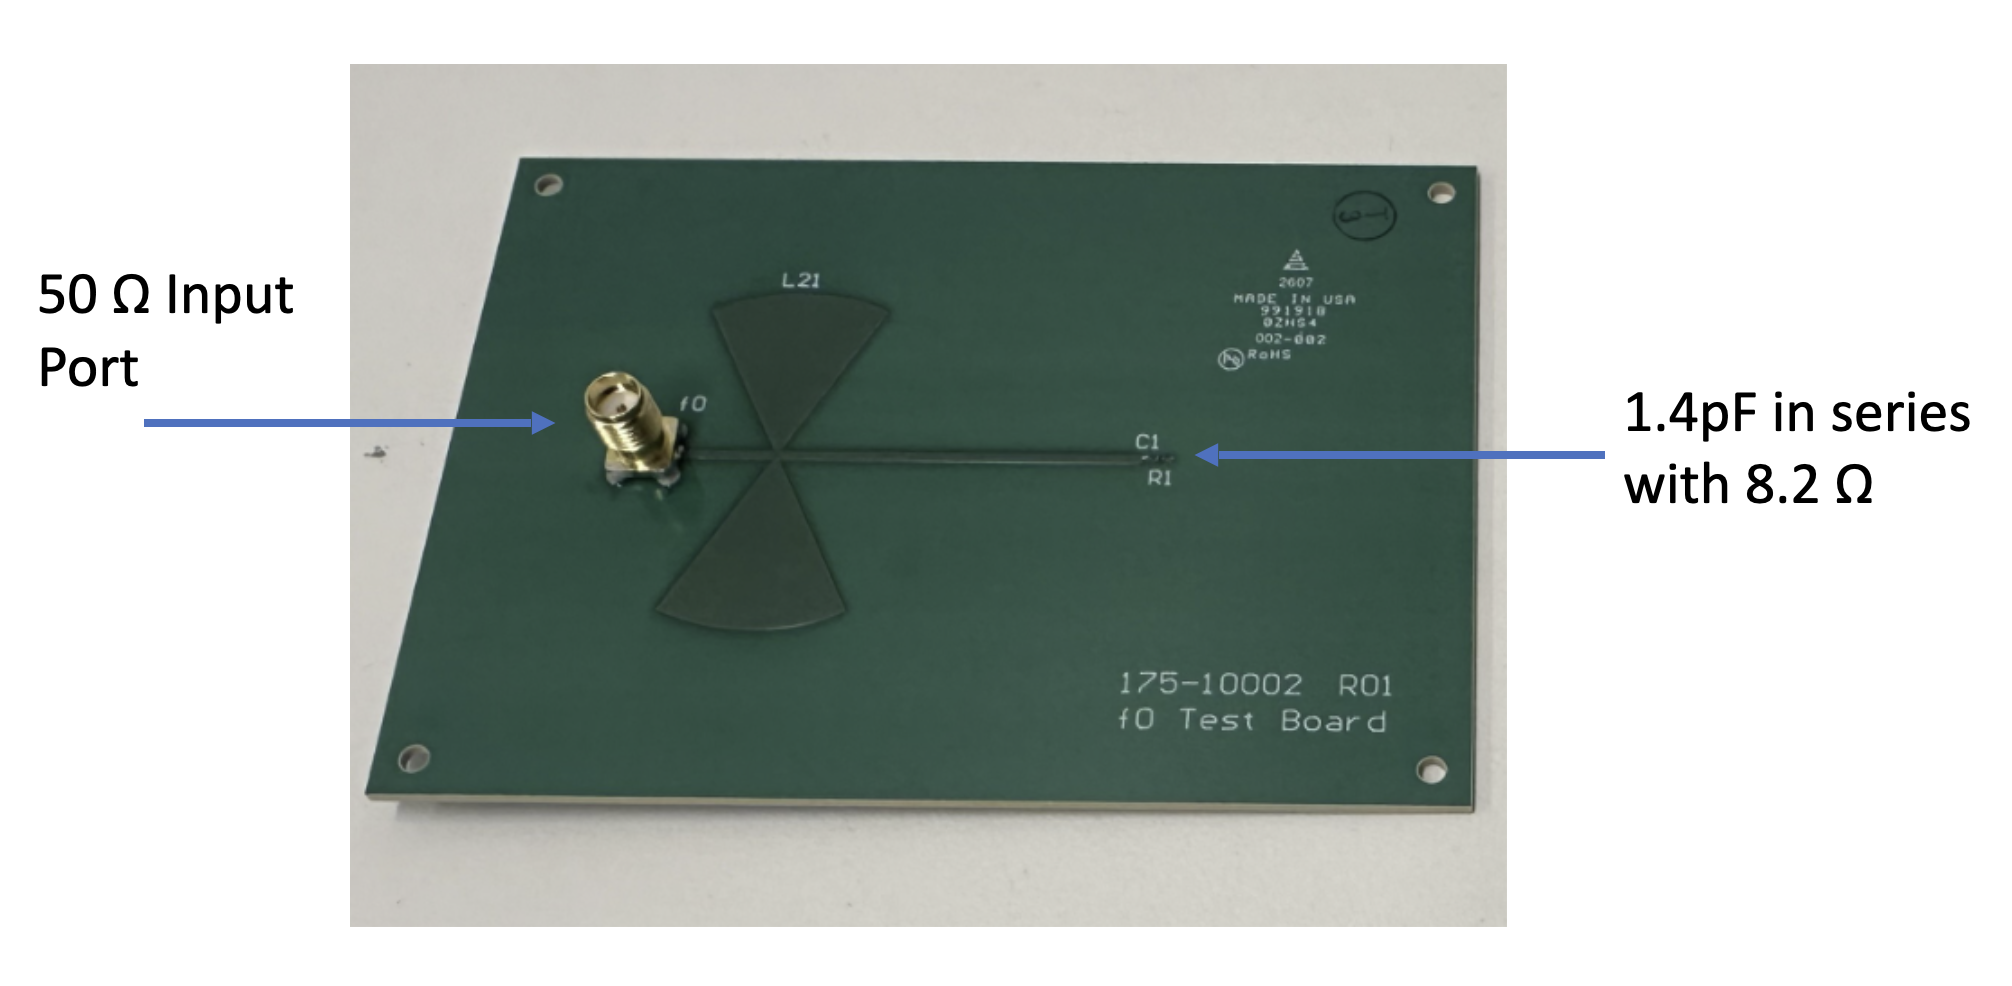
Figure 1 shows the board and the measurement setup used in the test.
These details are important because simulation and measurement only make sense when the setup is clearly defined.
What the simulation comparison showed
When the simulated S11 views are placed side by side, the resonance placement already tells part of the story. In this test, the COMSOL view places the notch near 875 MHz, while the CENOS view places it around 890 MHz. Since the measured boards later cluster around 894.78 MHz, the CENOS result is visibly closer to the tested hardware in frequency, almost exactly the same as tested hardware.
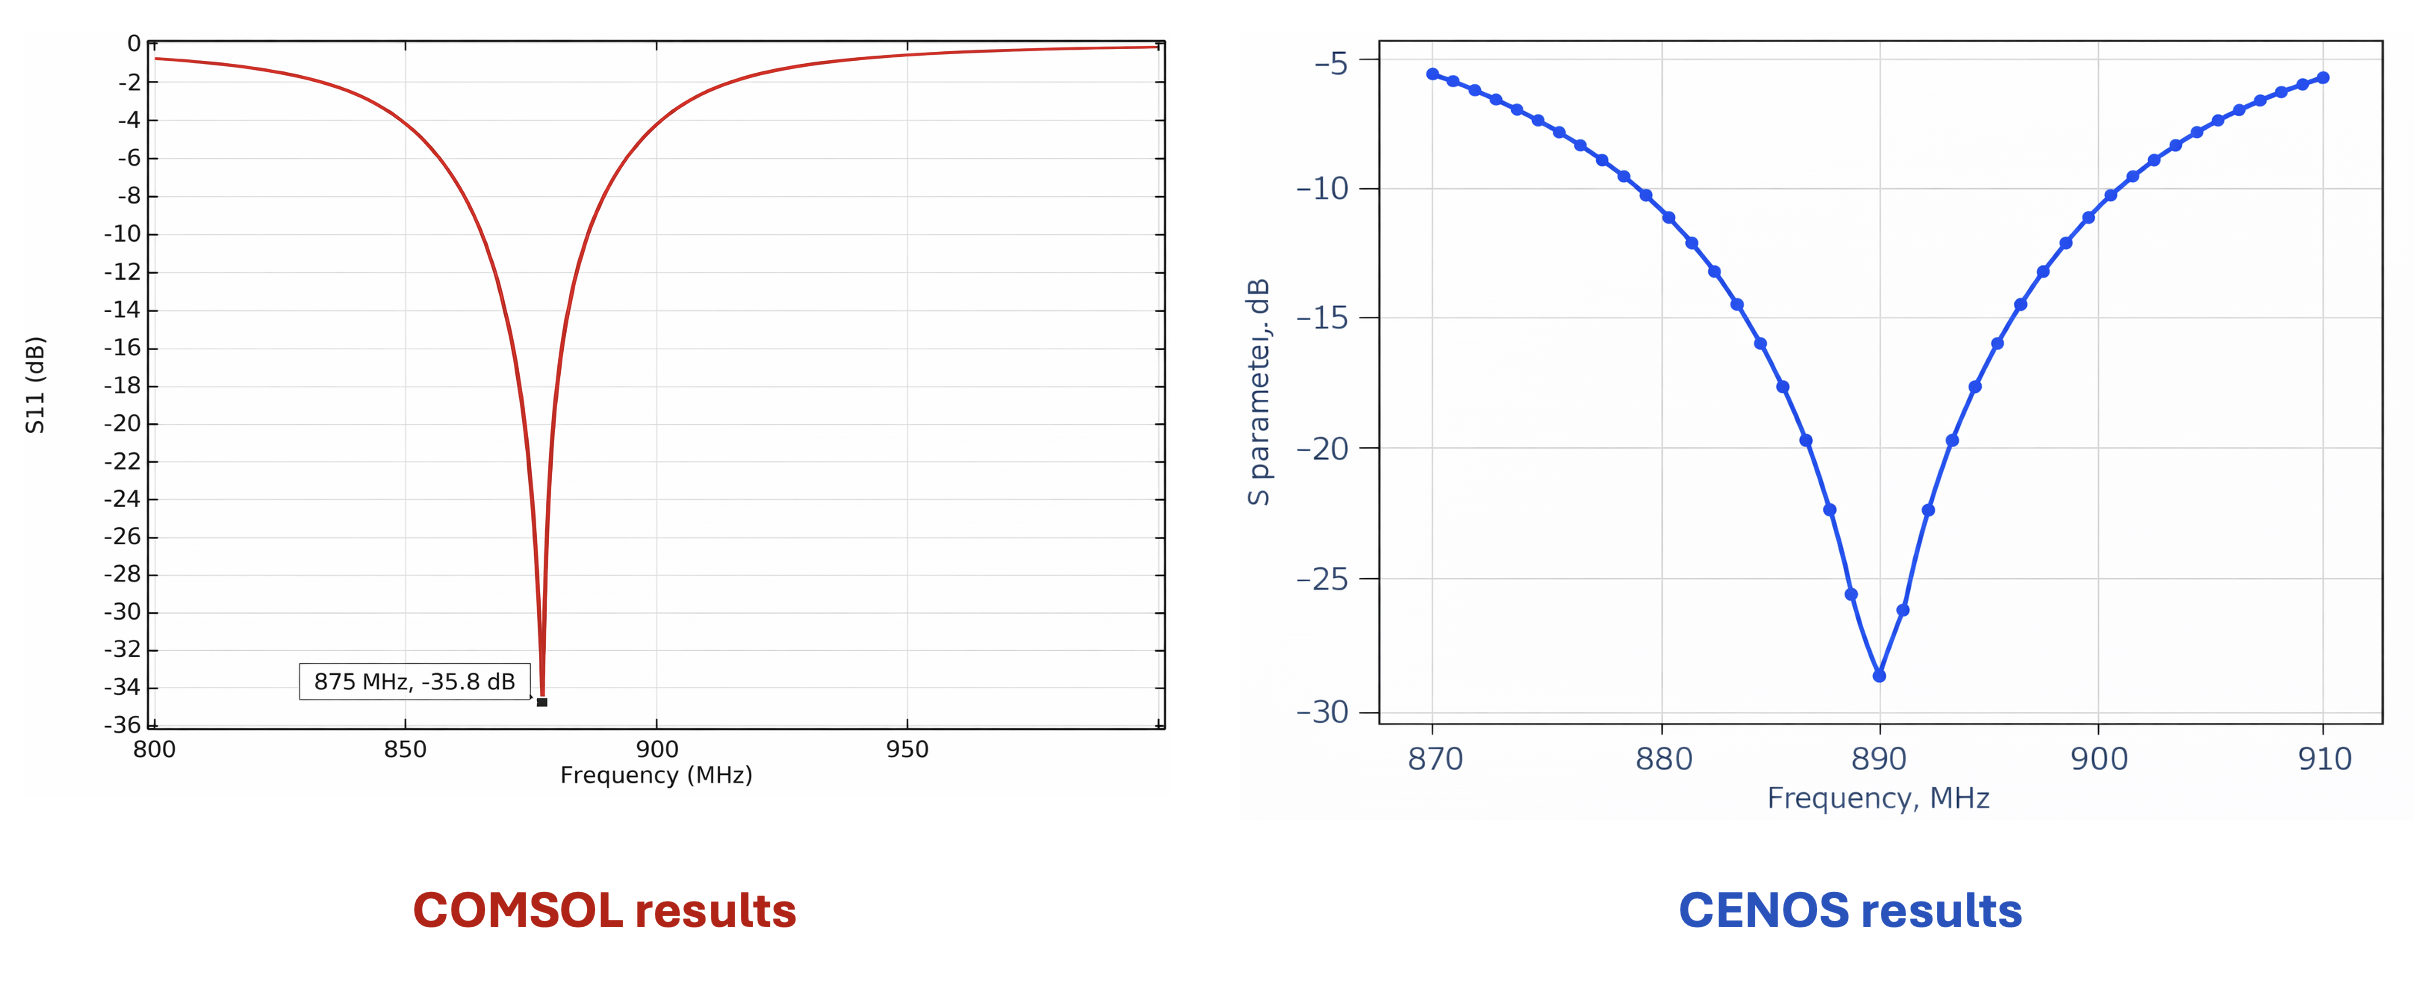
Figure 2 shows the simulated S11 comparison.
Simulation platforms are built for broad and demanding engineering work, and each has its own strengths depending on the use case, setup, and model assumptions. But in this specific comparison, the resonance location predicted by CENOS was almost identical to the measured board behavior.
And for early design decisions, that is a big deal.
Before teams worry about perfect notch depth, they usually need to know whether the design is landing in the right region at all. If the resonance is off by tens of megahertz, the next step may be a redesign. If it lands close to the measured hardware, the team can move forward with much more confidence.
What the full data showed
The full overlay of the nine measured traces, their mean response, and the CENOS simulation curve makes the benchmark easier to read.
First, it shows that the measured boards have a visible spread. That is expected in manufactured hardware, and it is part of why a multi-board comparison is more convincing than a single-board match.
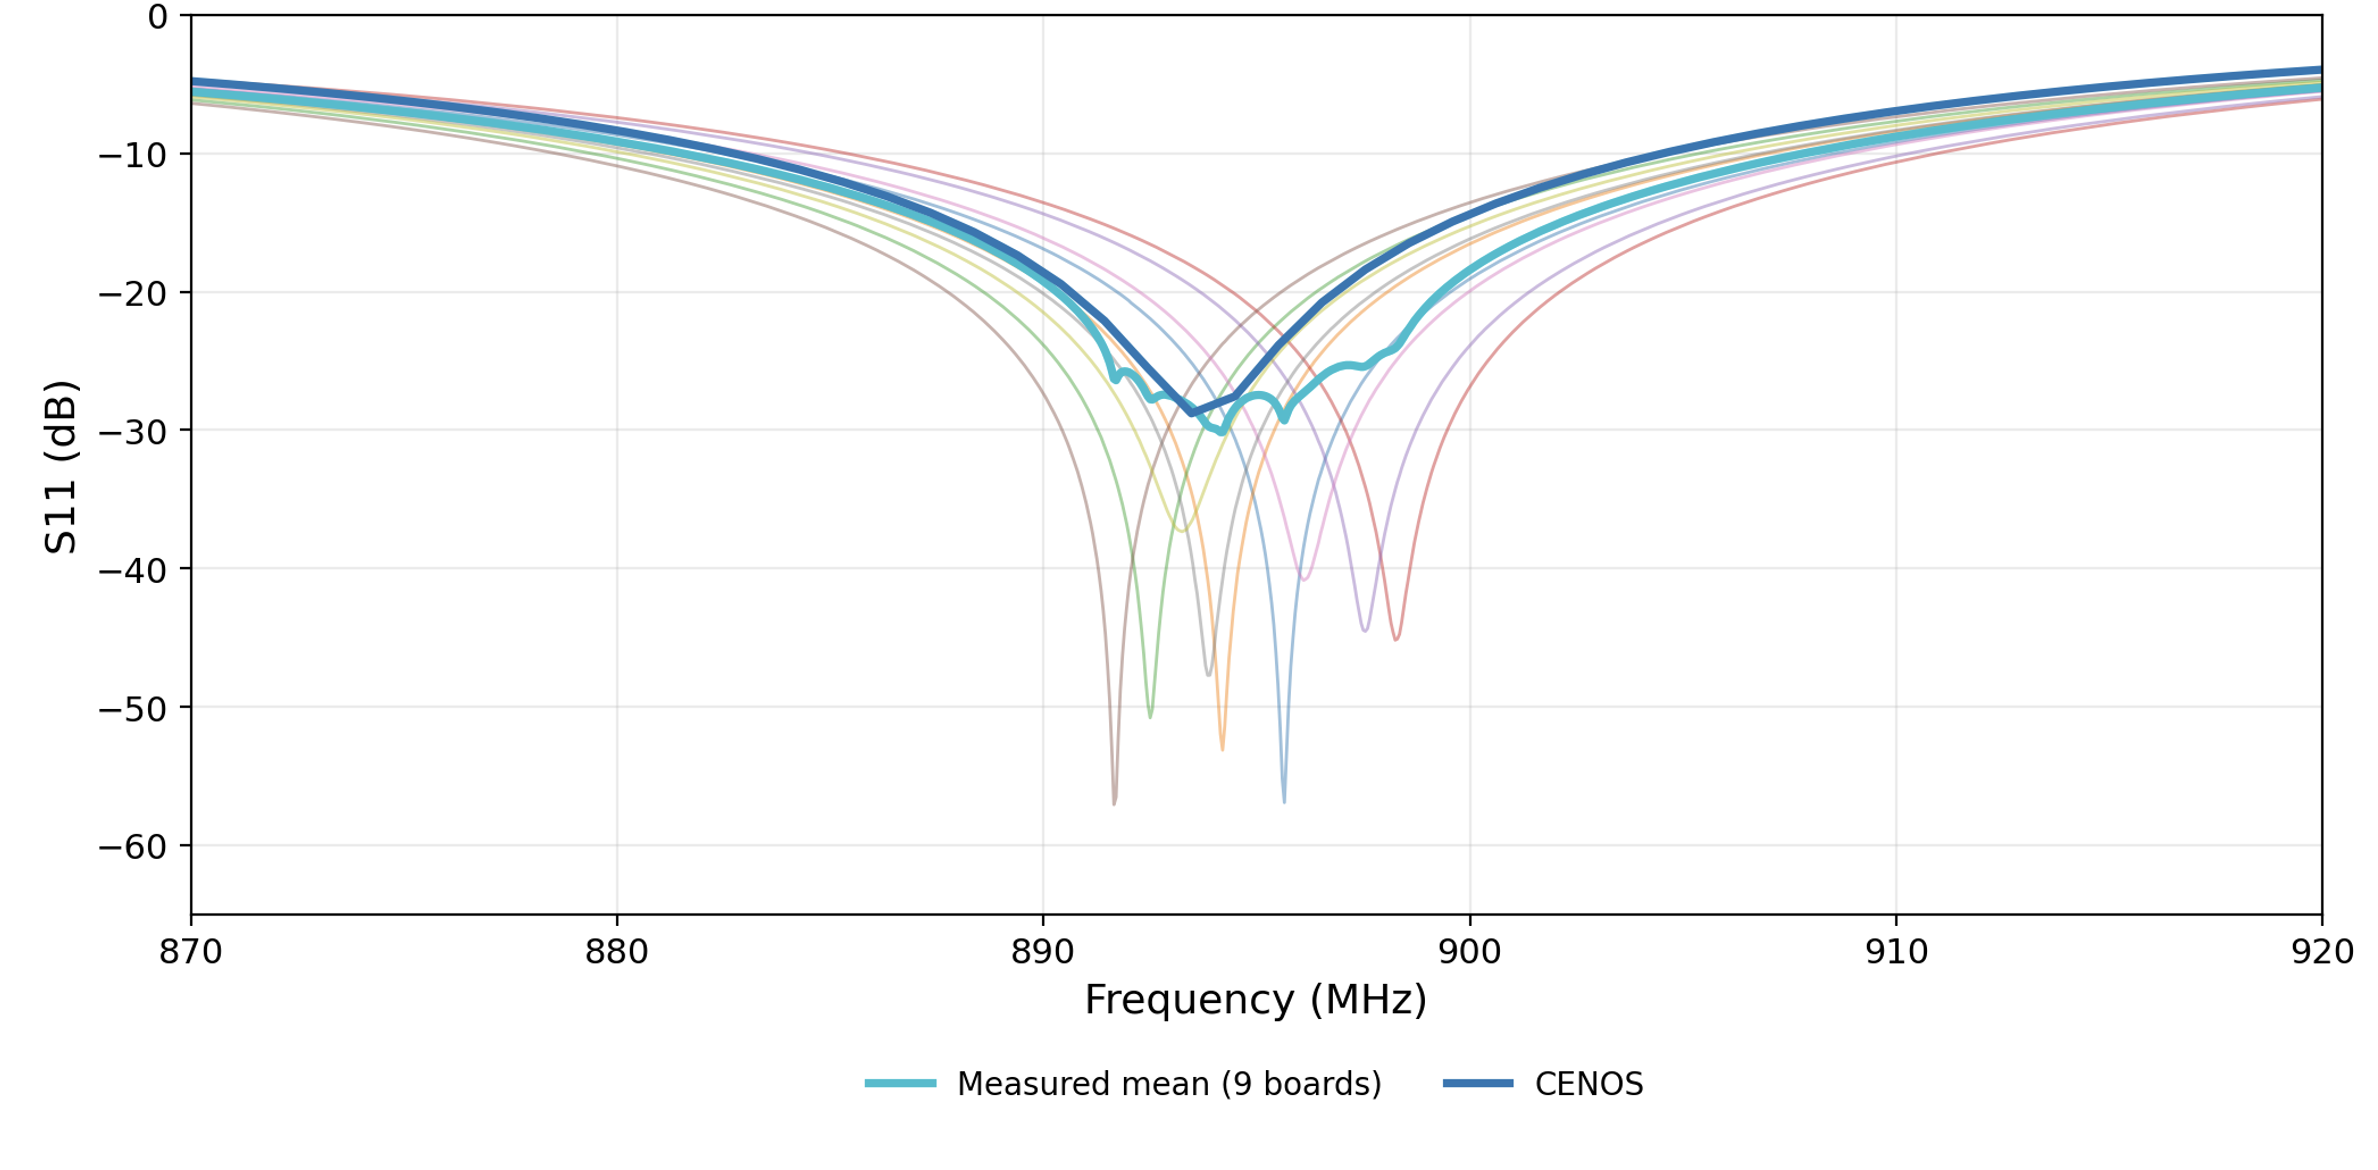
Figure 3 shows the measured traces, the measured mean, and the CENOS simulation together.
Second, it shows that the CENOS curve passes through the same resonance region as the measured cluster. It lands where engineers would want it to land if they are using simulation to make the next design decision.
Board-by-board resonance positions
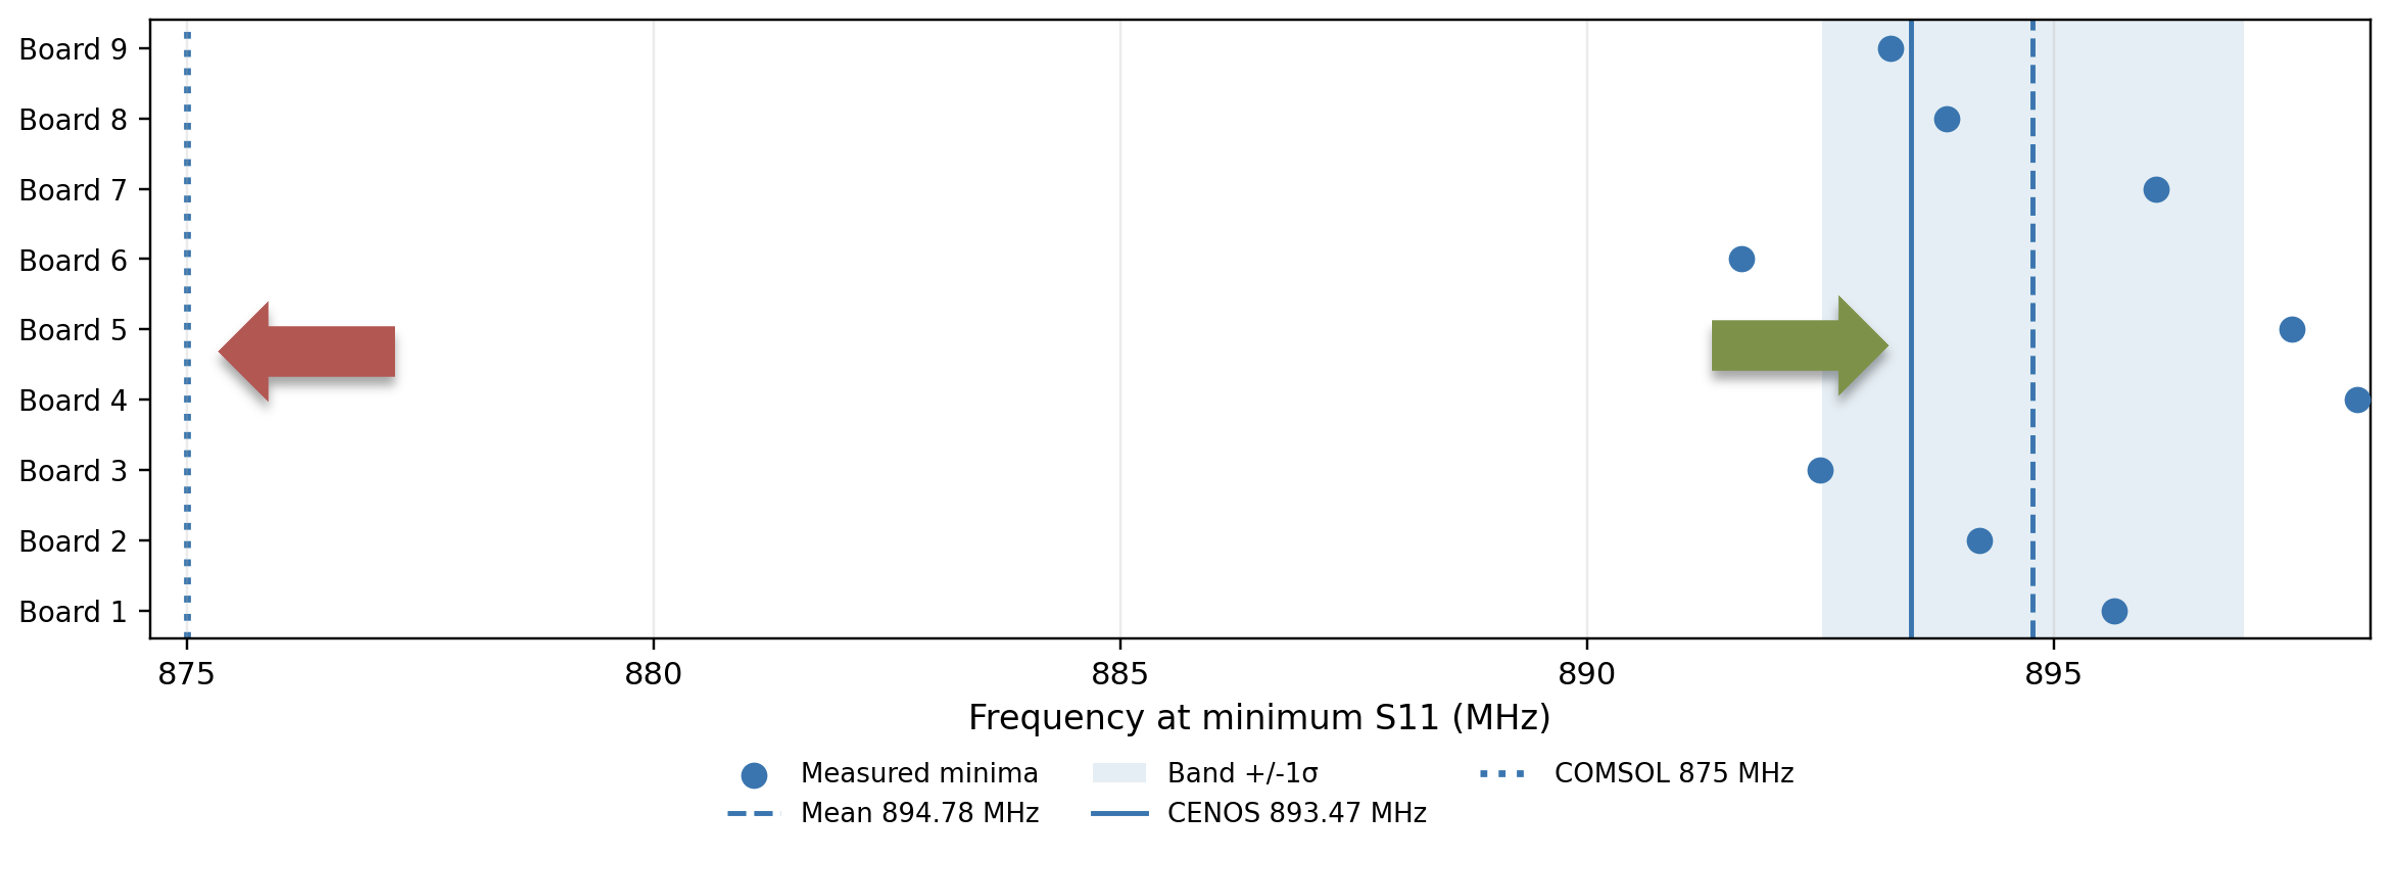
Figure 4. Frequency at minimum S11 for each measured board, compared with the measured mean, 1-sigma band, CENOS, and COMSOL.
This view strips away curve shape and keeps only the resonance position. The measured boards span 891.65 MHz to 898.25 MHz, and the CENOS minimum falls inside that observed range.
| Measured mean resonance 894.78 MHz |
CENOS raw-curve minimum 893.47 MHz |
COMSOL reference 875 MHz |
That is how simulation is usually used in practice. Not as a replacement for all testing, but as a way to reduce blind iteration and move into testing with a better starting point.
Why companies use simulation tools like CENOS
The most useful takeaway is that this is exactly what simulation should do in engineering work.
A good simulation tool helps engineers make decisions earlier. It helps them see whether resonance is landing where it should, whether a design direction is right, and whether the next hardware step is likely to confirm the approach rather than restart it.
That does not remove the need for physical boards, lab measurements, or validation. Physical testing is still where manufacturing variation, fixtures, tolerances, and final performance are checked. But simulation changes the quality of that process. Instead of building first and hoping the design is in the right range, engineers can build with a much clearer expectation of what they will see.
And that is exactly what simulation is supposed to do.
