Calculating mechanical properties
CENOS is capable of calculating different mechanical properties of parts as a result of induction hardening, such as hardened zone, microstructure and resulting hardness
Phase change calculation
Simulating the hardening process of steel requires understanding the steel phases formed during heat treatment. This is crucial for predicting material properties and performance.
The CENOS platform includes a Phase calculation model that enables accurate computation of steel phases such as austenite, bainite, pearlite, and martensite.
How to use phase calculation?
Once your geometry is prepared, you can proceed to define the material parameters in the Material customization window. Follow these steps:
- Enable Phase calculation
Check the Phase Calculation option in the Material Customization window. - Define Key Parameters
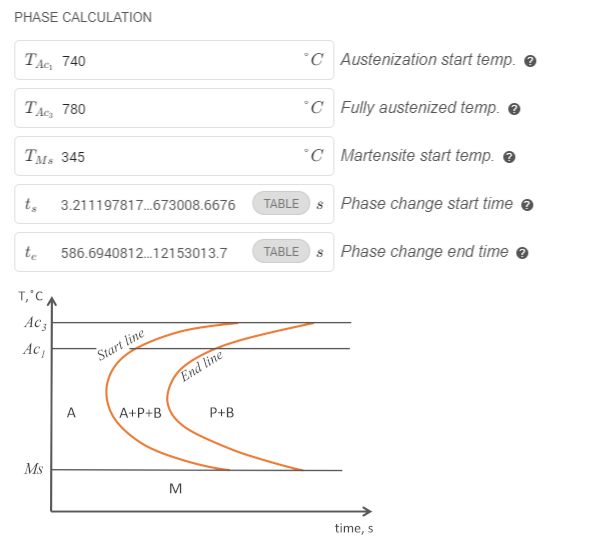
Specify the following parameters to ensure accurate calculations:- TAc1 (if available): The temperature at which the transformation to austenite begins.
- TAc3: The temperature at which the steel structure becomes fully austenitic.
- TMs: The temperature at which martensite formation begins.
- ts: The start time of the phase change, typically defined as when 1% of transformation occurs.
- te: The end time of the phase change, typically when 99% of the transformation is complete.
- Guidance on TAc1
If the temperature for TAc1 is not available, you may use the value of TAc3 as a substitute.
An example of how to get data from a TTT diagram.
To accurately calculate phase changes, you need data derived from a TTT (Time-Temperature-Transformation) diagram. The TTT diagram provides critical information on the timing and temperature of phase transformations. Below is an explanation of how to interpret and adjust the data:
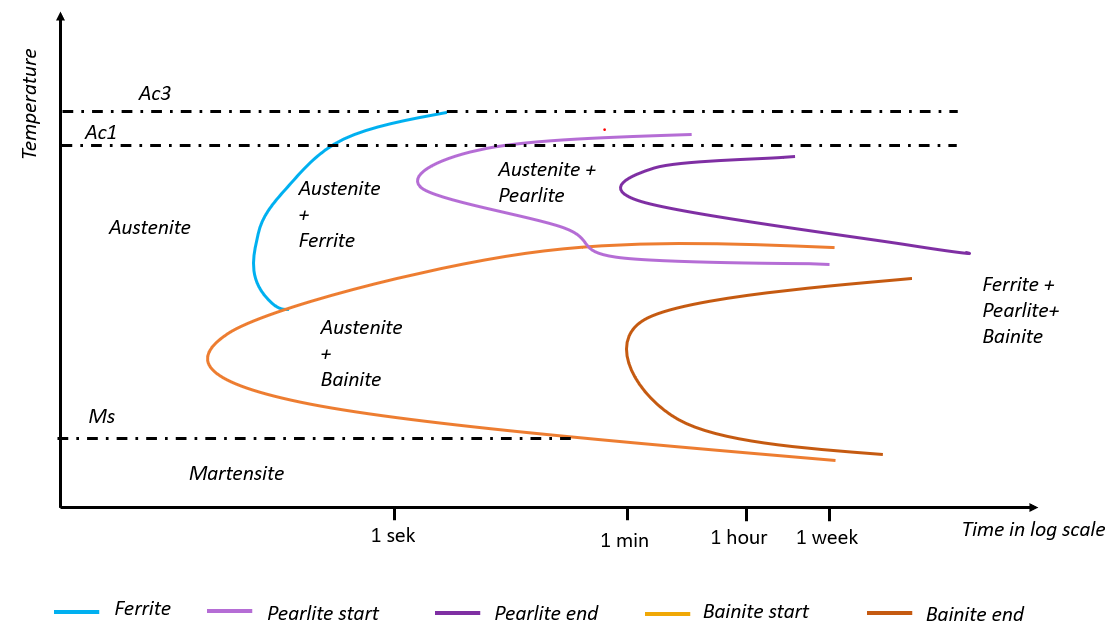
Interpreting the TTT Diagram
- Combining Phases
- In the Phase Calculation model, bainite, pearlite, and ferrite are treated as a single phase.
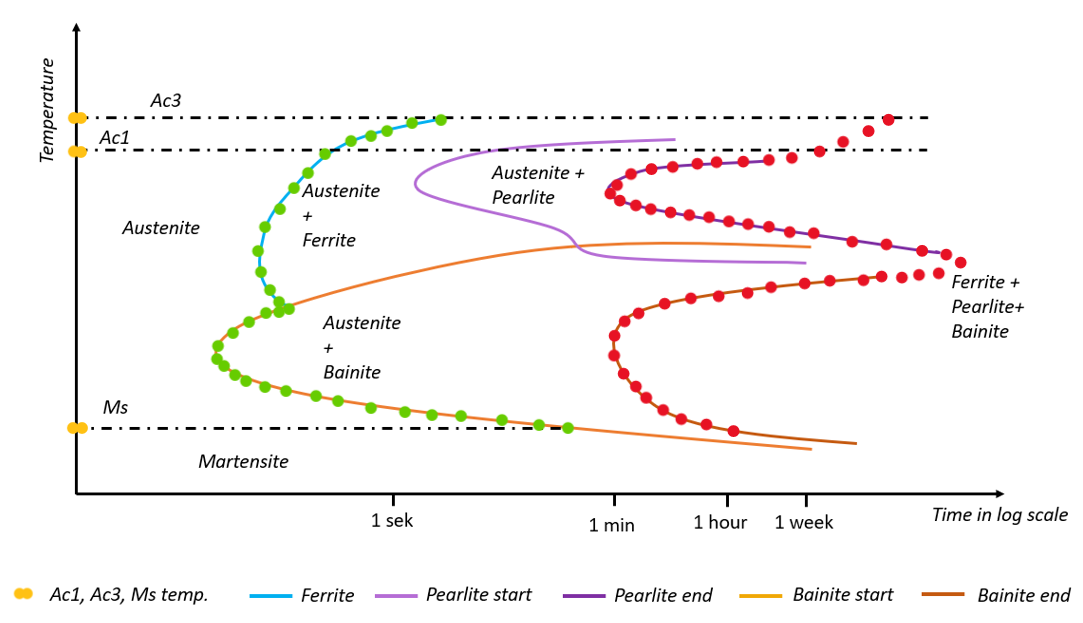
- To account for this, connect the start lines for ferrite and bainite (e.g., using green dots in the diagram).
- Similarly, connect the end lines for pearlite and bainite (e.g., using red dots in the diagram).
- Defining ts and te Data
- The start time (ts) and end time (te) for phase changes must be defined within the temperature range from TMs (martensite start temperature) to TAc3 (the temperature at which the structure is fully austenite).
- Extrapolating Missing Data
- If the end line in the TTT diagram does not extend to the TAc3 line (as in the example), you must extrapolate the line. This step is essential to ensure the Phase Calculation Model functions correctly
An example of how to treat TTT diagram to get the data for ts and te:
Hardness calculation
CENOS offers two hardness calculation models designed to estimate steel hardness after heat treatment. Both models will be described in the chapters below.
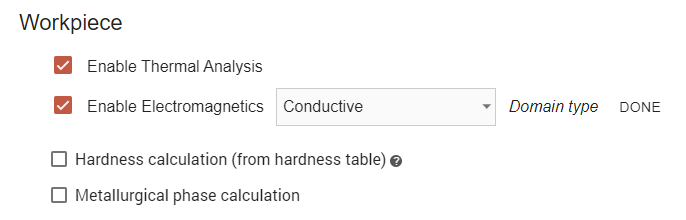
How to enable hardness calculation models?
- Ensure that thermal physics is enabled for the domain where you wish to calculate hardness.
- Once thermal physics is activated, Hardness Calculation model and a Phase calculation model will become available.
- Select hardness calculation. Additional input parameters may be required.
Hardness calculation from the table
Key Inputs and Calculation
This model calculates material hardness based on cooling time. To use this method, you need to provide data in a tabular format with the following parameters:
- Cooling Time (in seconds)
- Achieved Hardness (in any unit, such as HV, HRC, etc.)
Additionally, you must specify:
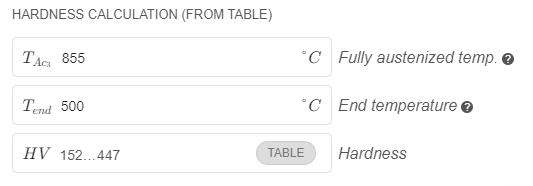
- Austenitization Temperature (TAc3)
- End Temperature (Tend)
The end temperature (Tend) depends on the data provided in the table. For instance, if the table includes critical cooling times between 800°C and 500°C, set Tend = 500°C.
A reliable source for such material properties is the Ovako Steel Navigator, which provides heat treatment diagrams (see the example below). Similar diagrams to the one needed for this model can be found there.
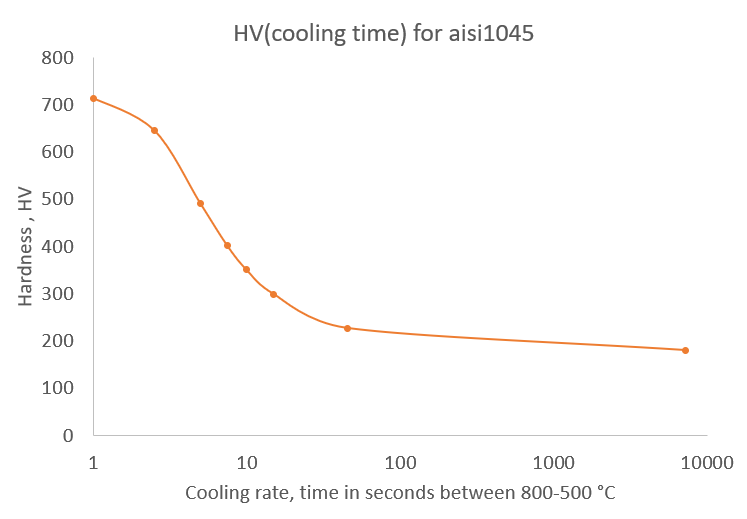
Another option is to use hardness data commonly found in CCT (Continuous-Cooling Transformation) diagrams. These diagrams display the hardness achieved by the material based on the cooling time elapsed from the austenitization temperature (TAc3).
Take note: In the example diagram below, hardness is presented using different scales, such as HV and HRC. Ensure you standardize the scale to avoid inconsistencies in your calculations. [1].
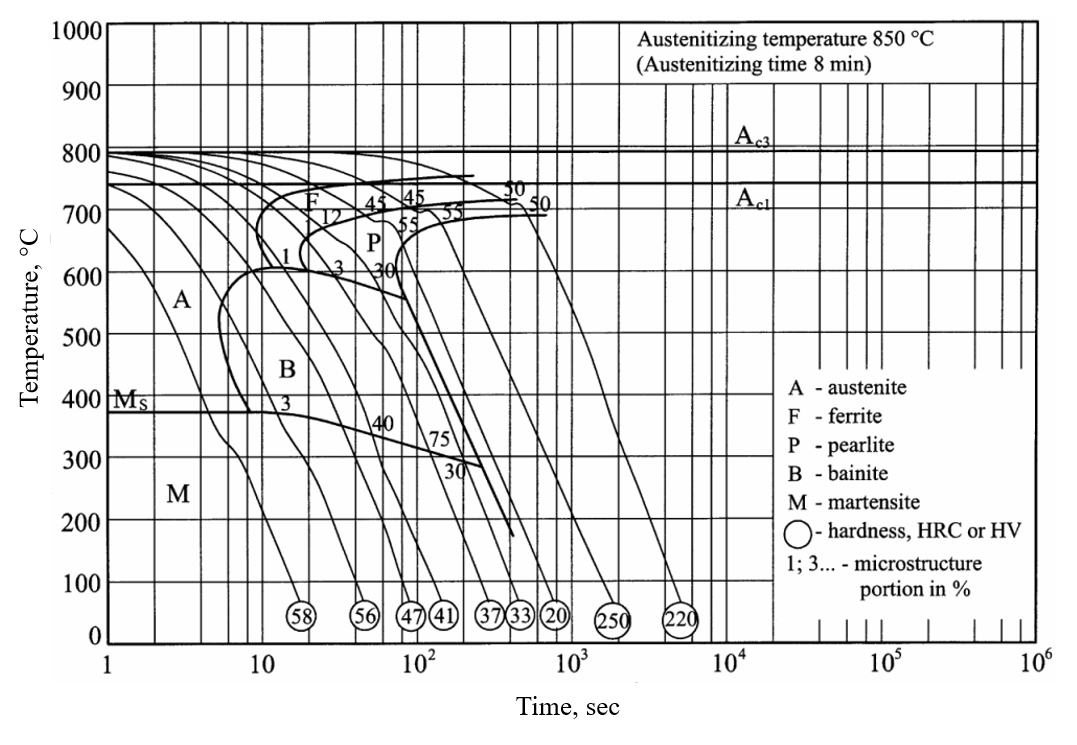
Important: It is important to recalculate the hardness to one scale and use the same units for all data otherwise, the results will be meaningless!
Example
In this case, the end temperature (Tend) is equal to the martensite start temperature (TMs). Since the TMs temperature varies throughout the process, we recommend using the temperature at the beginning of the process—approximately 380°C in this example.
Below is a preview of the model definition in CENOS:
Limitations
The error of calculated hardness depends on the quality of the given HV table data.
References
[1] “Atlas of steels heat treatment”, A. Rose, H. Hougardy, 1972.
