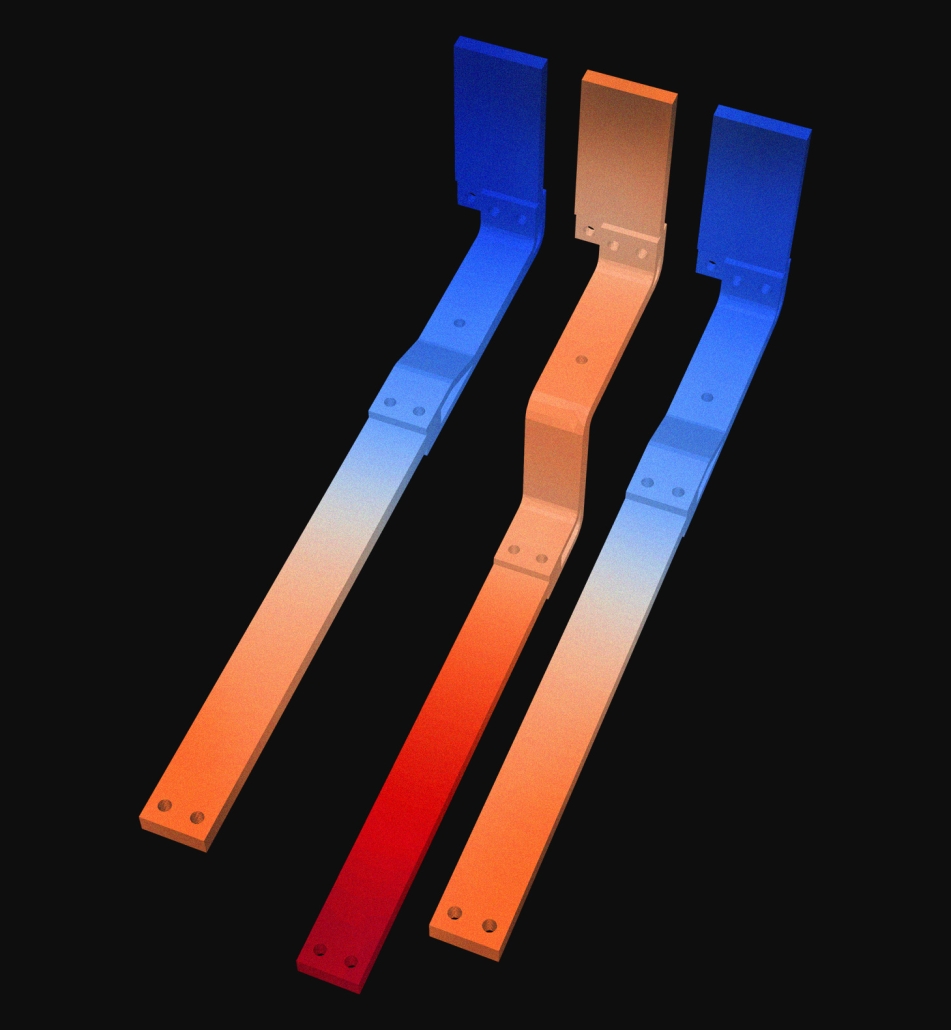
Lorentz force in a 3 phase bus bar during short-circuit
This animation visualizes the Lorentz force density distribution within a 3-phase bus bar during a short-circuit event.
Here’s what can be observed:
- Color map indication:
- The color scale represents the Lorentz force density, with red indicating positive (outward) forces and blue indicating negative (inward) forces.
- Neutral areas are shown in white, indicating minimal or no force.
- Phase interaction:
- The bus bar segments experience varying Lorentz forces due to the high current during the short circuit.
- These forces arise from the interaction between the magnetic fields generated by the adjacent phases and the current flowing in the conductors.
- Force distribution and dynamics:
- The distribution of forces differs along the length of the bus bars. This is primarily due to the electromagnetic field interactions that depend on the relative positions of the phases and the current magnitude.
- Structural deformation implication:
- The visualization helps in predicting the stress points where the forces are strongest. These are critical areas for structural integrity during high-current events.
This type of simulation is crucial for engineers to analyze and optimize the design of bus bars, ensuring they can withstand the electromagnetic forces generated during fault conditions without deformation or failure. It also helps in verifying compliance with safety standards and improving the overall reliability of electrical systems.
