Scanning and hardening of a gear: case study
Induction hardening gears require precise control to achieve optimal hardness patterns and durability. Whether dealing with small, medium, or large gears, engineers face the complexity of achieving consistent hardening across intricate gear teeth geometry.
Small and medium gears are often induction-hardened by encircling the entire component. It is a process known as “spin hardening.” For larger gears, however, engineers often use the slower, more intricate “tooth-by-tooth” method, where each tooth undergoes precise hardening. This process, though more time-intensive, enables high accuracy in achieving the required hardness profile.
In this case study we will focus on the “tooth-by-tooth” method more since it is more complex. But also analyze the simulation of induction hardening of smaller gears.
What is the challenge?
Two main techniques are usually used in tooth-by-tooth hardening:
- Tip-by-tip hardening: It is a single-shot or rotation mode that applies heat to a single tooth at a time. While it’s efficient, it often falls short of providing the fatigue and impact strength that is needed for larger gears.
- Gap-by-gap hardening: This preferred technique uses a scanning mode, where the inductor moves between tooth gaps. Here, the inductor geometry plays an important role, needing to match the tooth’s shape to target the root and/or flanks effectively. Precision is important, as overheating the tooth tips, especially at the beginning and end of the scan, can compromise the gear’s durability.
Before we dive into the simulating the gear induction hardening, here’s an example of real life induction hardening setup of a large gear.
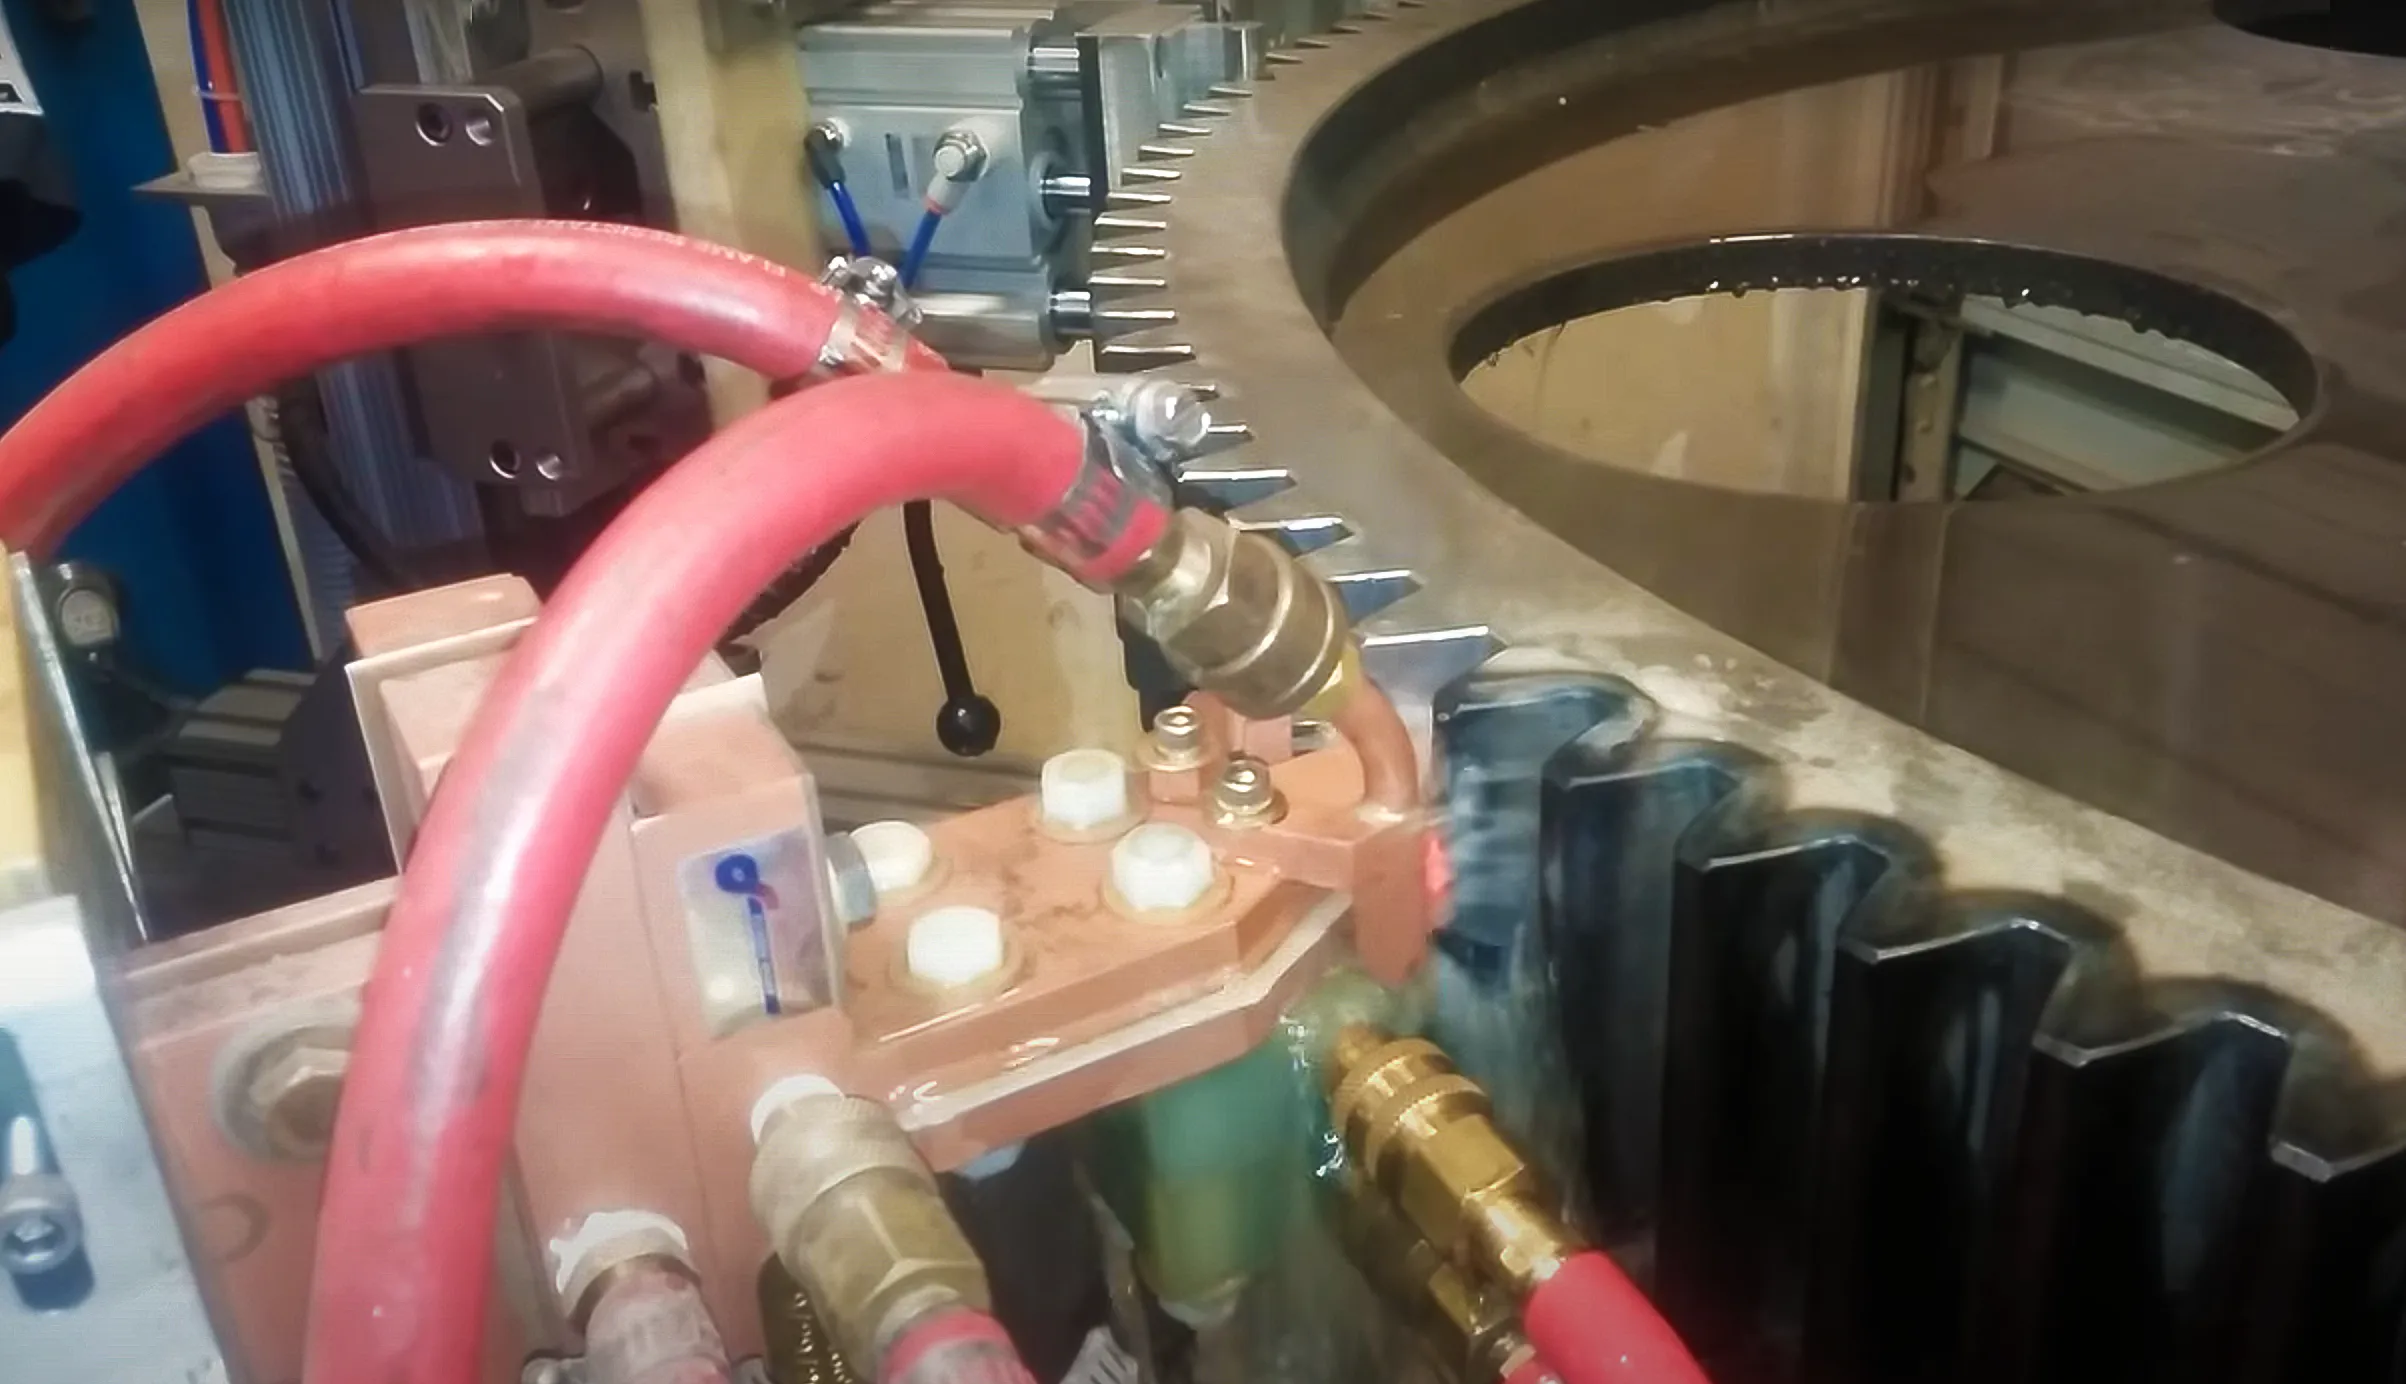
Image source from internet
Achieving these delicate balances between hardness and elasticity, avoiding overheating, and accounting for edge effects is challenging, especially when moving from gear to gear. Engineers and manufacturers need reliable, consistent solutions to save time, material, and costs without sacrificing quality.
What is the solution?
For engineers tackling the challenges of induction hardening, simulation software provides an invaluable advantage. Simulating the induction process allows engineers to design and refine inductor shapes, optimize heating parameters, and precisely control the depth and location of the hardening effect. Simulation ensures that each tooth is hardened accurately, meeting the gear’s fatigue and impact requirements without the risks of trial-and-error in real-world production.
In the following simulation images, engineers can analyze the induction hardening process applied to a large gear, focusing on a “tooth-by-tooth” approach. Here’s what each image reveals and how engineers can interpret the data:
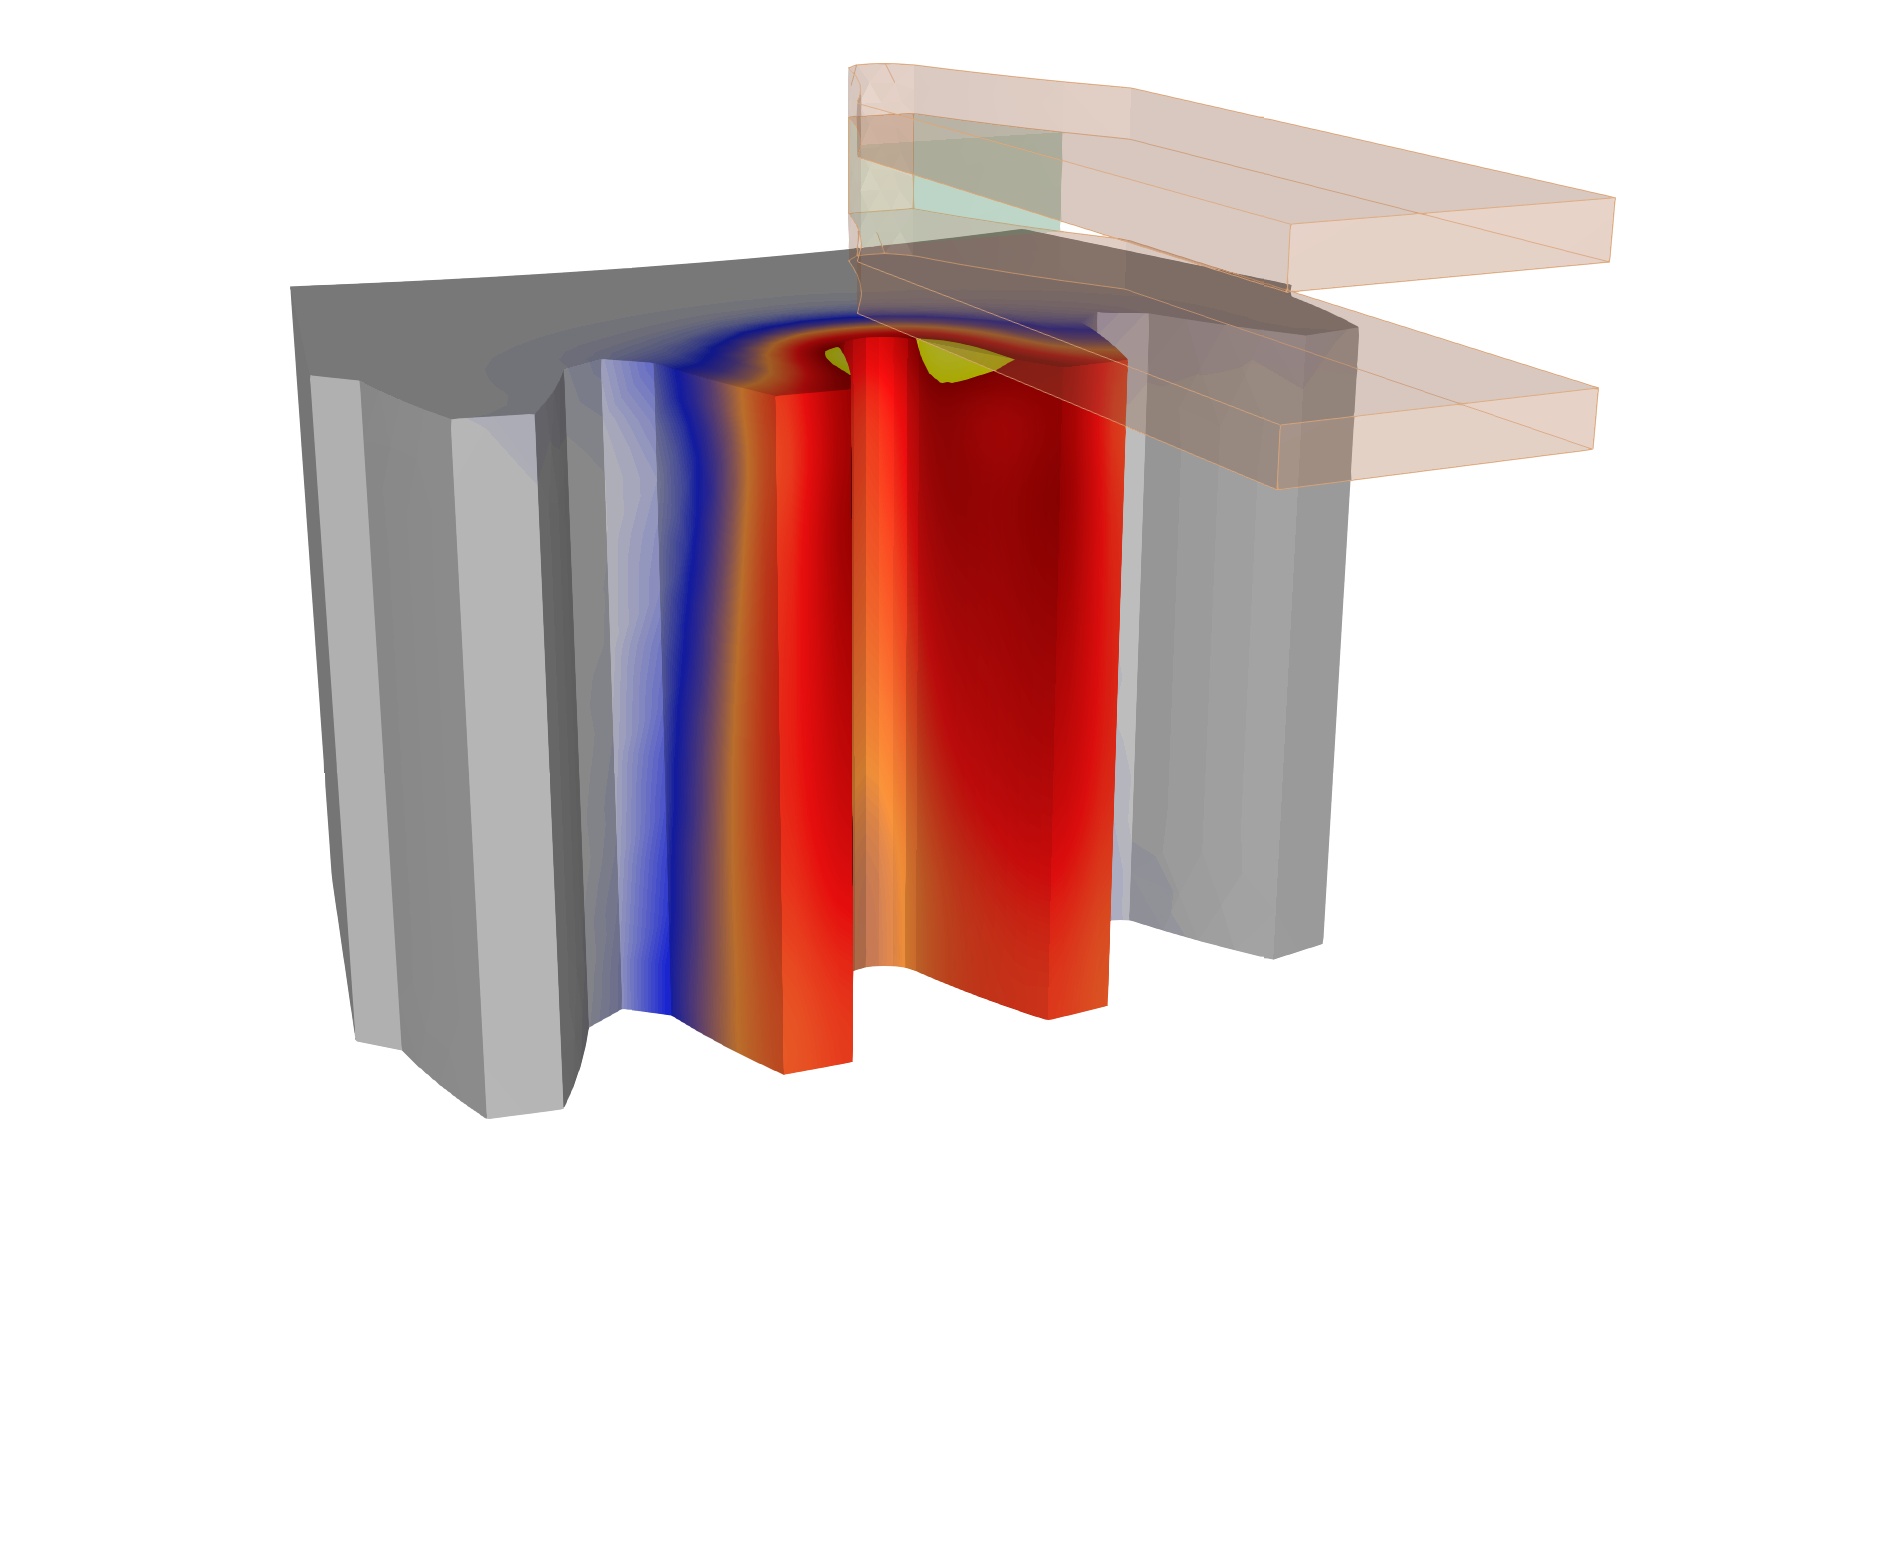
Heat distribution in a tooth-by-tooth hardening setup:
The colored regions represent the temperature gradient within a single tooth during the induction hardening process. Red areas indicate higher temperatures, while blue areas show cooler regions. This temperature distribution is crucial in ensuring the desired hardness profile.
Engineers can observe the concentration of heat in the tooth’s root and flank areas, which are critical for providing fatigue resistance. The tooth tip appears cooler, suggesting that it is not overly hardened, which is desirable for maintaining toughness.
By analyzing this heat map, engineers can determine whether the current inductor setup and scan rates are appropriate for achieving a uniform hardening pattern without risking overheating, particularly at the tooth tip.
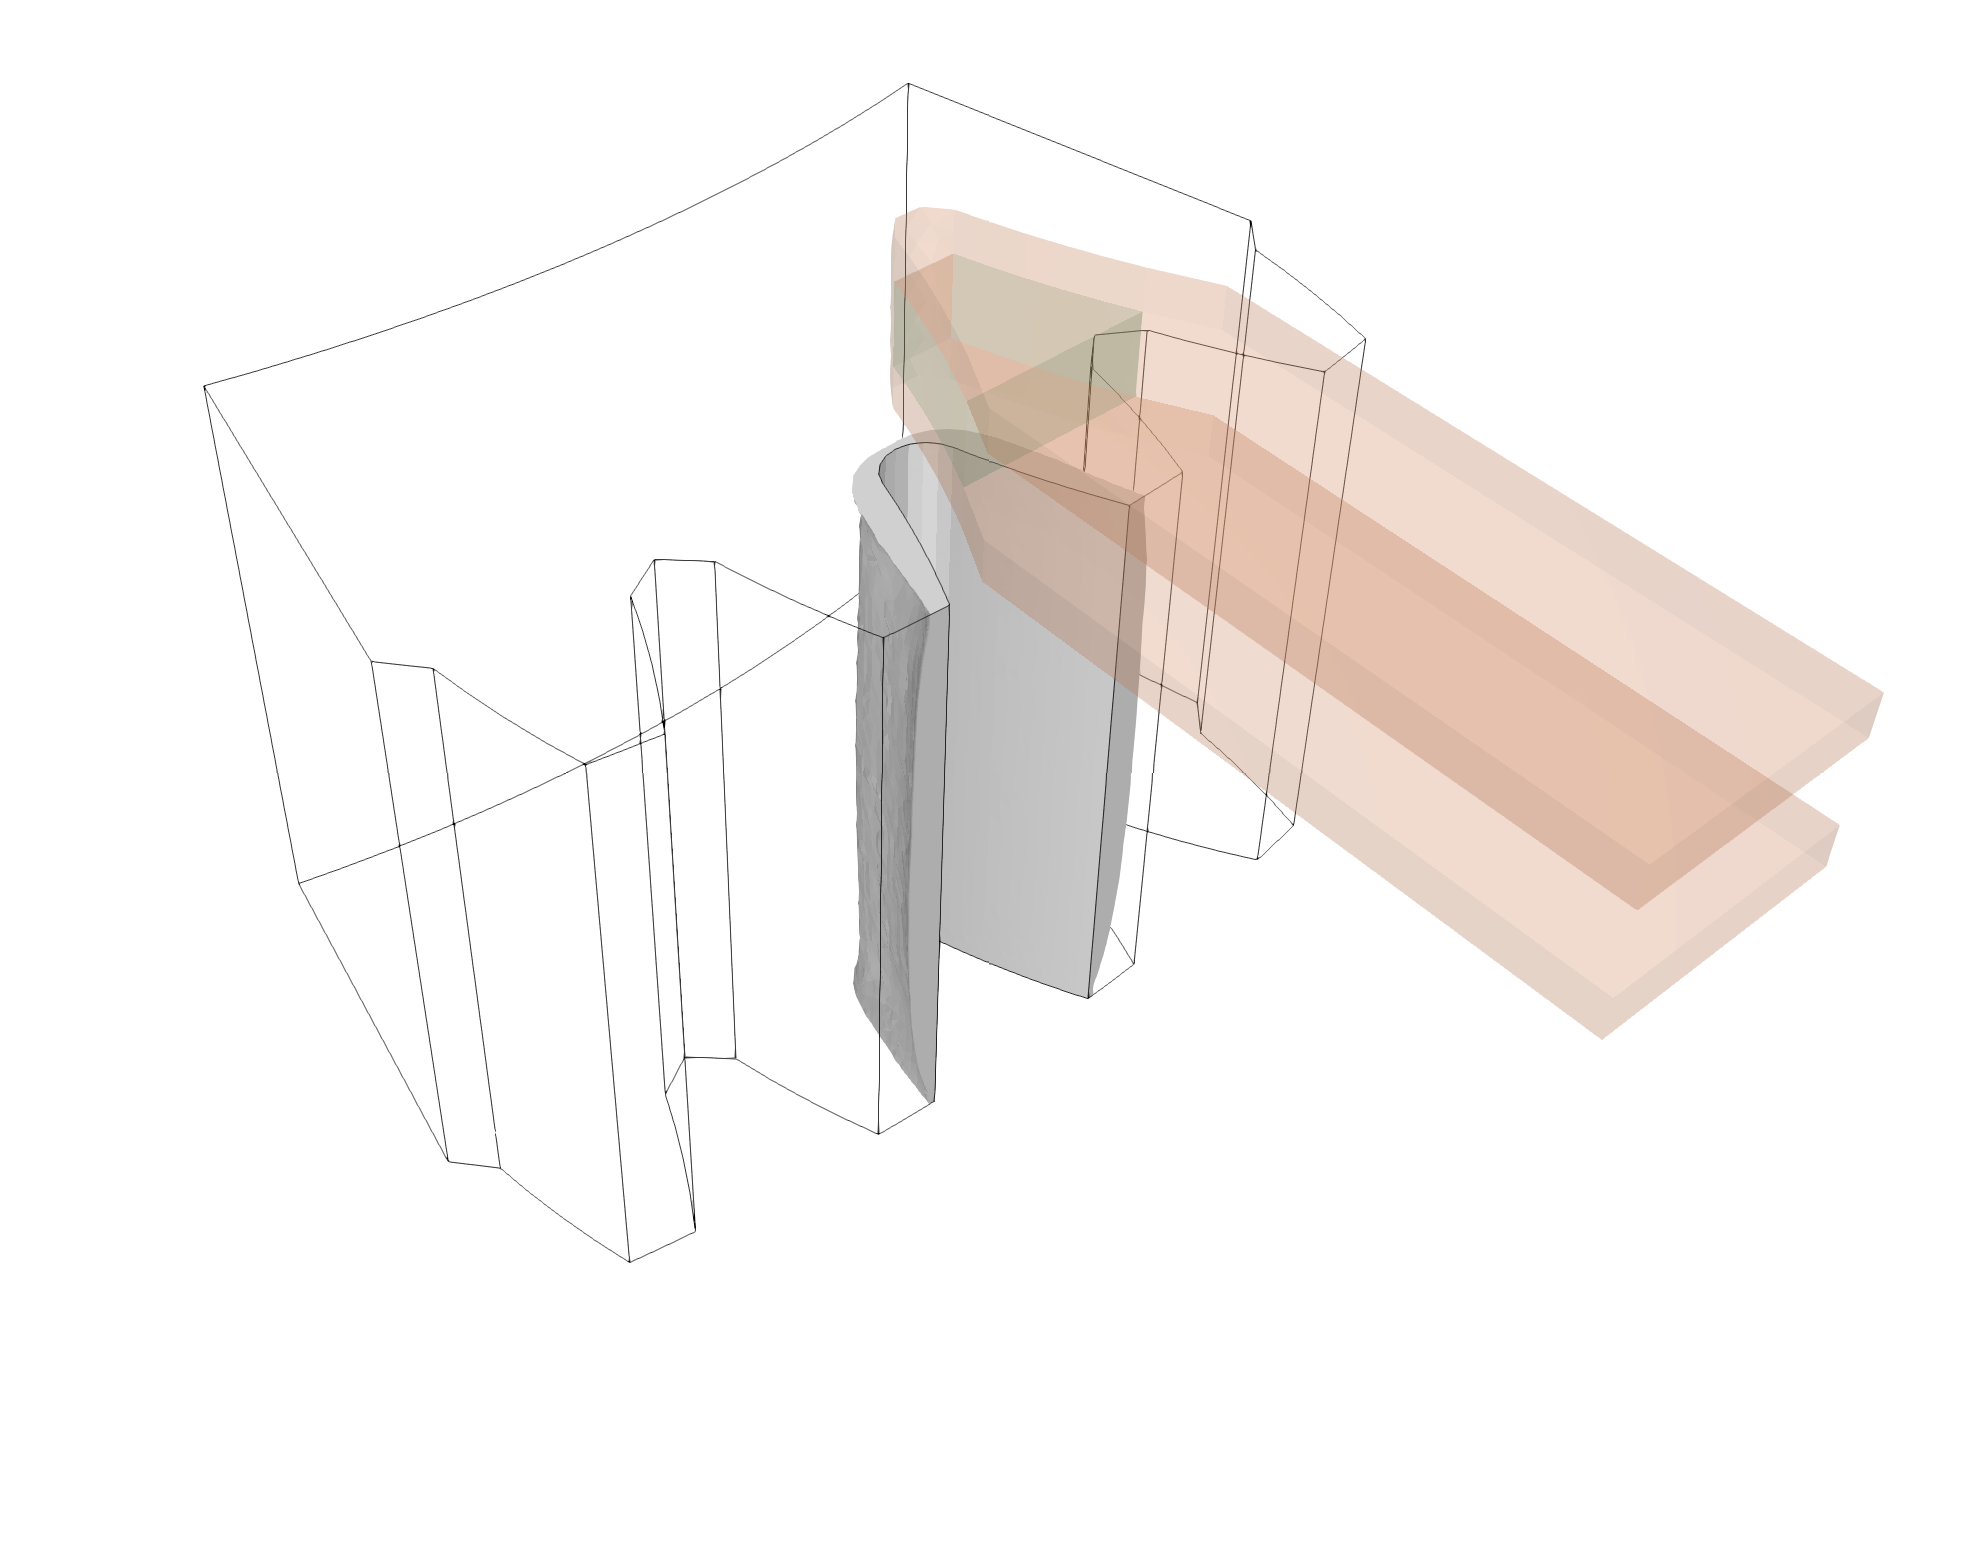
Inductor positioning and tooth geometry:
- This view provides a clearer outline of the inductor’s alignment with the gear tooth, highlighting the spatial relationship between the inductor and the tooth structure.
- Engineers can assess how well the inductor conforms to the geometry of the tooth. Proper alignment is essential to avoid uneven heating and ensure consistent hardening across all teeth.
- This profile view also allows engineers to experiment with different inductor designs to target specific areas, such as the root or flanks, based on the desired hardness pattern. Adjusting inductor positioning in simulation can help prevent thermal inconsistencies and reduce edge effects.
How to analyze the data:
- Temperature control: Use the temperature data to adjust inductor power, scan rates, and positioning to achieve a balanced hardening pattern that meets the gear’s mechanical requirements.
- Uniformity and consistency: The color gradient should be consistent across the entire tooth profile, particularly in critical areas such as the root and flank. Any hot spots or uneven patterns may indicate a need for calibration in inductor design or scan speed.
- Overheating prevention: Pay attention to the edges and tooth tips, as these areas are prone to overheating. Simulation helps in optimizing parameters to avoid localized excessive heating, which could compromise the gear’s structural integrity.
The 3D animation images enable engineers to visualize and refine the induction hardening process virtually, reducing trial-and-error in real production and ensuring gears meet precise hardness specifications.
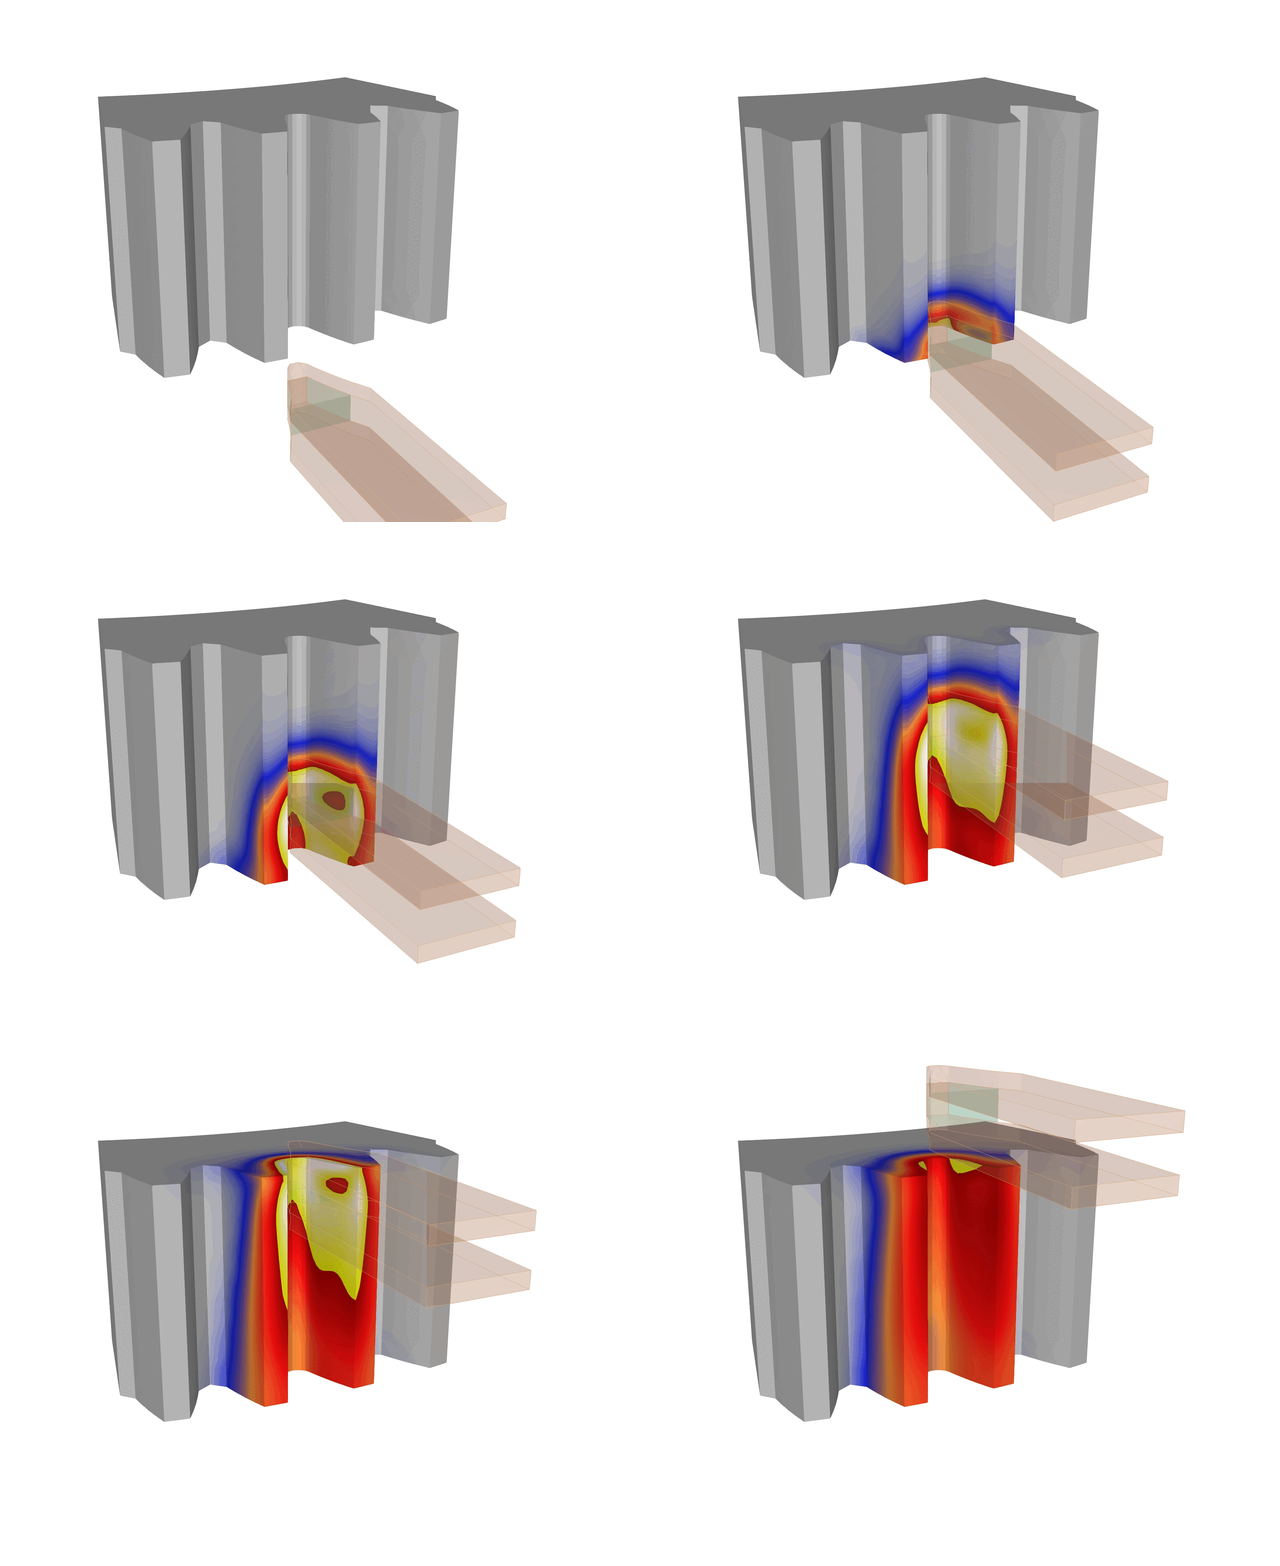
In the case of large gears, simulation software aids in configuring the inductor and testing “gap-by-gap” methods, replicating scenarios where the inductor must move seamlessly between teeth. Simulation prevents potential overheating by optimizing the scan rates and inductor positions, reducing the risk of unbalanced temperature distribution. Engineers can even test various inductor designs virtually, ensuring that flanks and roots achieve uniform hardness, leaving the tooth tips and core appropriately ductile.
Simulation also allows teams to explore the differences between stationary gear setups versus moving inductor designs, which has proven more effective in large gears. With simulation, engineers can preemptively address edge effects and prevent overheating in the tip and flank regions. This precision saves companies not only in material costs but also in production time, enhancing efficiency without risking quality.
Small gear induction hardening
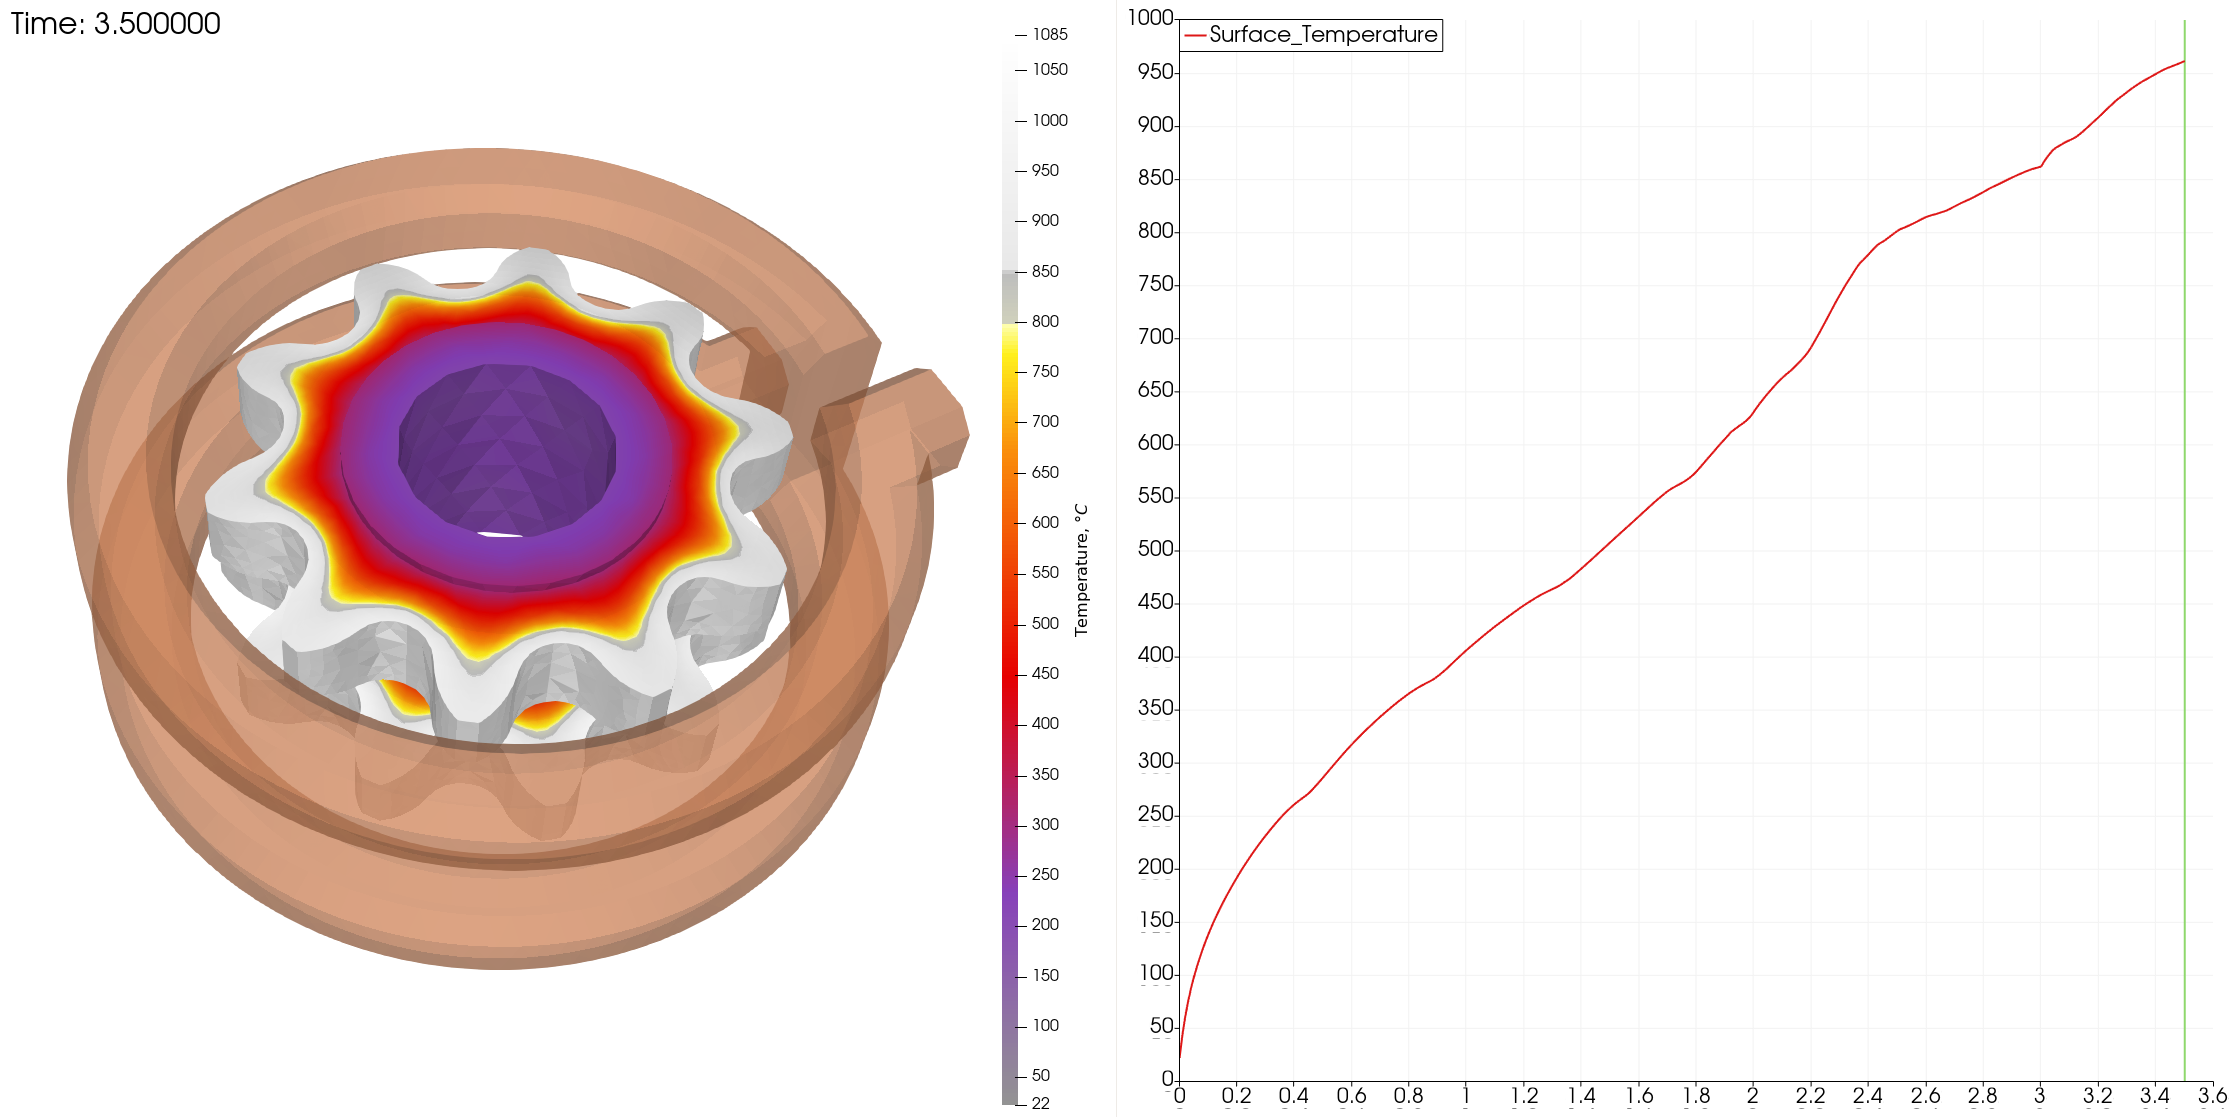
The hardening process for smaller gears are simpler, although the challenges remain similar. It is still about avoiding overheating of the parts, equal heating and energy saving to optimize the manufacturing processes.
Differences compared to large gear hardening
In contrast to large gears, where a “tooth-by-tooth” approach is often required, small gears can be heated more uniformly across the entire gear surface through a process known as “spin hardening.” This method uses a single, encircling coil to heat the entire surface simultaneously, allowing for a more efficient, quicker hardening cycle.
- Heating method: Small gears are generally hardened by heating the entire gear simultaneously (encircling/spin hardening), whereas large gears often use a tooth-by-tooth approach, requiring more time and precision to achieve uniform hardness.
- Magnetic flux distribution: The flux density is easier to manage in small gears due to the gear’s compact size and the coil’s proximity to all surfaces. In large gears, maintaining even flux density across all teeth requires careful coil alignment and scan rates.
- Efficiency: Small gears can achieve hardening in a single step, making the process faster and less complex than for large gears, where tooth-by-tooth hardening and specific inductor design adjustments are necessary.
What is the result?
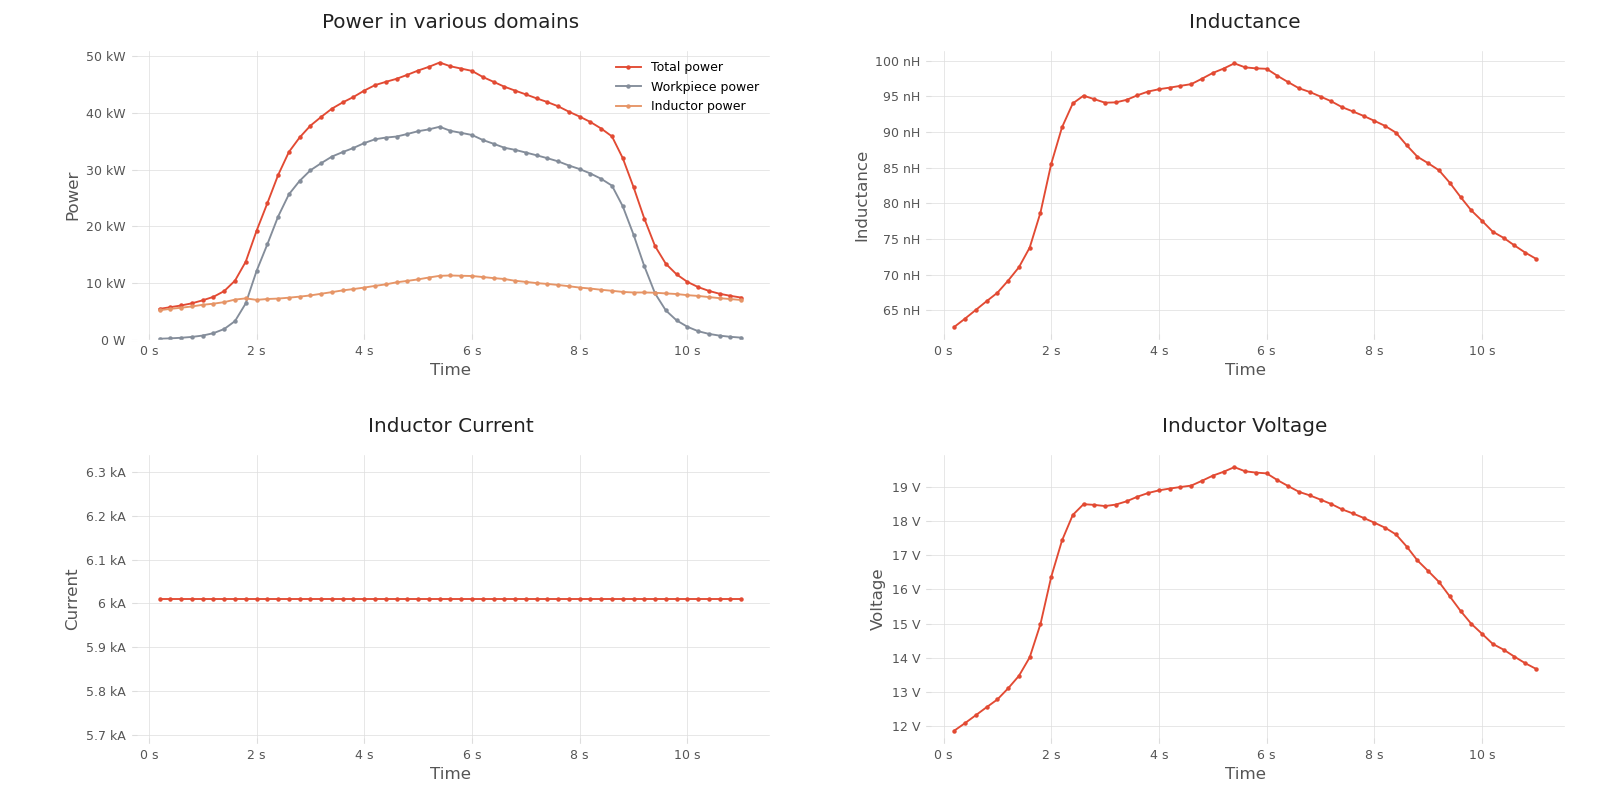
The graphs provided from the simulation offer valuable insights into the dynamics of the induction hardening process for gears. Here’s a breakdown of what each graph represents and the information engineers can extract:
Power in various domains:
- This graph shows the total power, workpiece power, and inductor power over time.
- Engineers can observe that total power reaches a peak around 5 seconds, aligning closely with the peak in workpiece power. The workpiece power represents the energy directly transferred to the gear, which is crucial for achieving the required hardness in the tooth-by-tooth process.
- The difference between the total power and workpiece power reflects energy loss or inefficiencies in the system, which could be due to factors like heating of the inductor itself.
- Monitoring these power levels helps engineers fine-tune the energy input to ensure that the gear heats uniformly without overloading the system or wasting energy.
Inductance:
- The inductance graph shows how inductance varies over the duration of the process.
- A rise in inductance at the beginning indicates the system’s initial response as the inductor and workpiece come into alignment. The peak represents the point at which the magnetic field is fully established, essential for effective induction heating.
- Engineers can track the inductance drop-off at the end of the process, signaling the dissipation of the magnetic field as the heating cycle concludes.
- This data can guide adjustments to the inductor design and positioning to maintain stable inductance and achieve consistent heating.
Inductor current:
- This graph shows the current through the inductor, which remains relatively steady around 6 kA throughout the process.
- A constant current indicates a stable induction process, as fluctuations could lead to inconsistent heating.
- Engineers can use this information to verify that the current is appropriately set to achieve the desired heating pattern without creating excess stress on the inductor or the power supply.
Inductor voltage:
- The voltage applied to the inductor rises at the beginning, reaching a peak around 5 seconds, then decreases as the process winds down.
- This voltage profile is critical in managing the intensity and distribution of the magnetic field for heating.
- Engineers can adjust voltage parameters based on this graph to ensure that heating intensity is optimal during the process’s peak phase, minimizing power usage while still achieving desired hardness levels.
With the implementation of simulation software, induction hardening of gears, whether large, medium, or small, becomes a more manageable, precise, and efficient process. Engineers gain control over hardening patterns, making sure that every tooth achieves the desired mechanical properties while minimizing material waste and production delays.
Simulation doesn’t just improve processes, it helps engineers maintain strict standards in quality, enabling better durability and performance for gears under heavy loads.
The proper use of simulation software transforms how manufacturers approach gear hardening, allowing companies to deliver high-performing gears faster and more economically. By solving the challenges in gear hardening with simulation, engineers can confidently design reliable and durable gears that meet industry demands.


