Single-shot hardening of CV (constant velocity) joint: case study
The hardening of metal components, particularly in high-wear applications like constant velocity (CV) joints, presents different challenges such as energy consumption, production time, and potential material waste.
Wear is only one of the problems hardening solves and not the largest one. Such components have cyclic stresses applied constantly, and metal under such conditions will suffer fatigue at some point, which will cause cracks to appear and damage the part. Hardening increases the part’s resistance to fatigue damage, which means it can perform longer and is, in general, stronger.
Unlike traditional methods that require multiple cycles, single-shot hardening uses induction heating to raise the temperature of the CV joint to the required level in just one pass. The part is then immediately quenched with liquid. This process minimizes energy usage and simplifies production, reducing both material and time costs.
What is the challenge?
The challenge is to design the inductor in the way the hardening profile is according to specification, with no excessive hardening where it is not required or deeper than it is required, and also to avoid unhardened zones, where they are required according to the part specification.
Local overheating of the peart can cause potential cracking and incomplete hardening, which can reduce the lifespan of the component. To deal with this, precision is very important—both in the design of the induction coil.
This case study explores how simulation software like CENOS can significantly improve the accuracy and efficiency of the single-shot hardening process, helping engineers save time and reduce costs while designing the coil and/or the process.
What is the solution?
The solution is in the use of simulation software, like CENOS, which allows engineers to optimize the hardening process in a virtual environment before committing to physical prototypes. With simulation, the design of inductors and flux concentrators can be tested and refined, significantly reducing the time and cost involved in multiple cycles of the physical trial and errors.
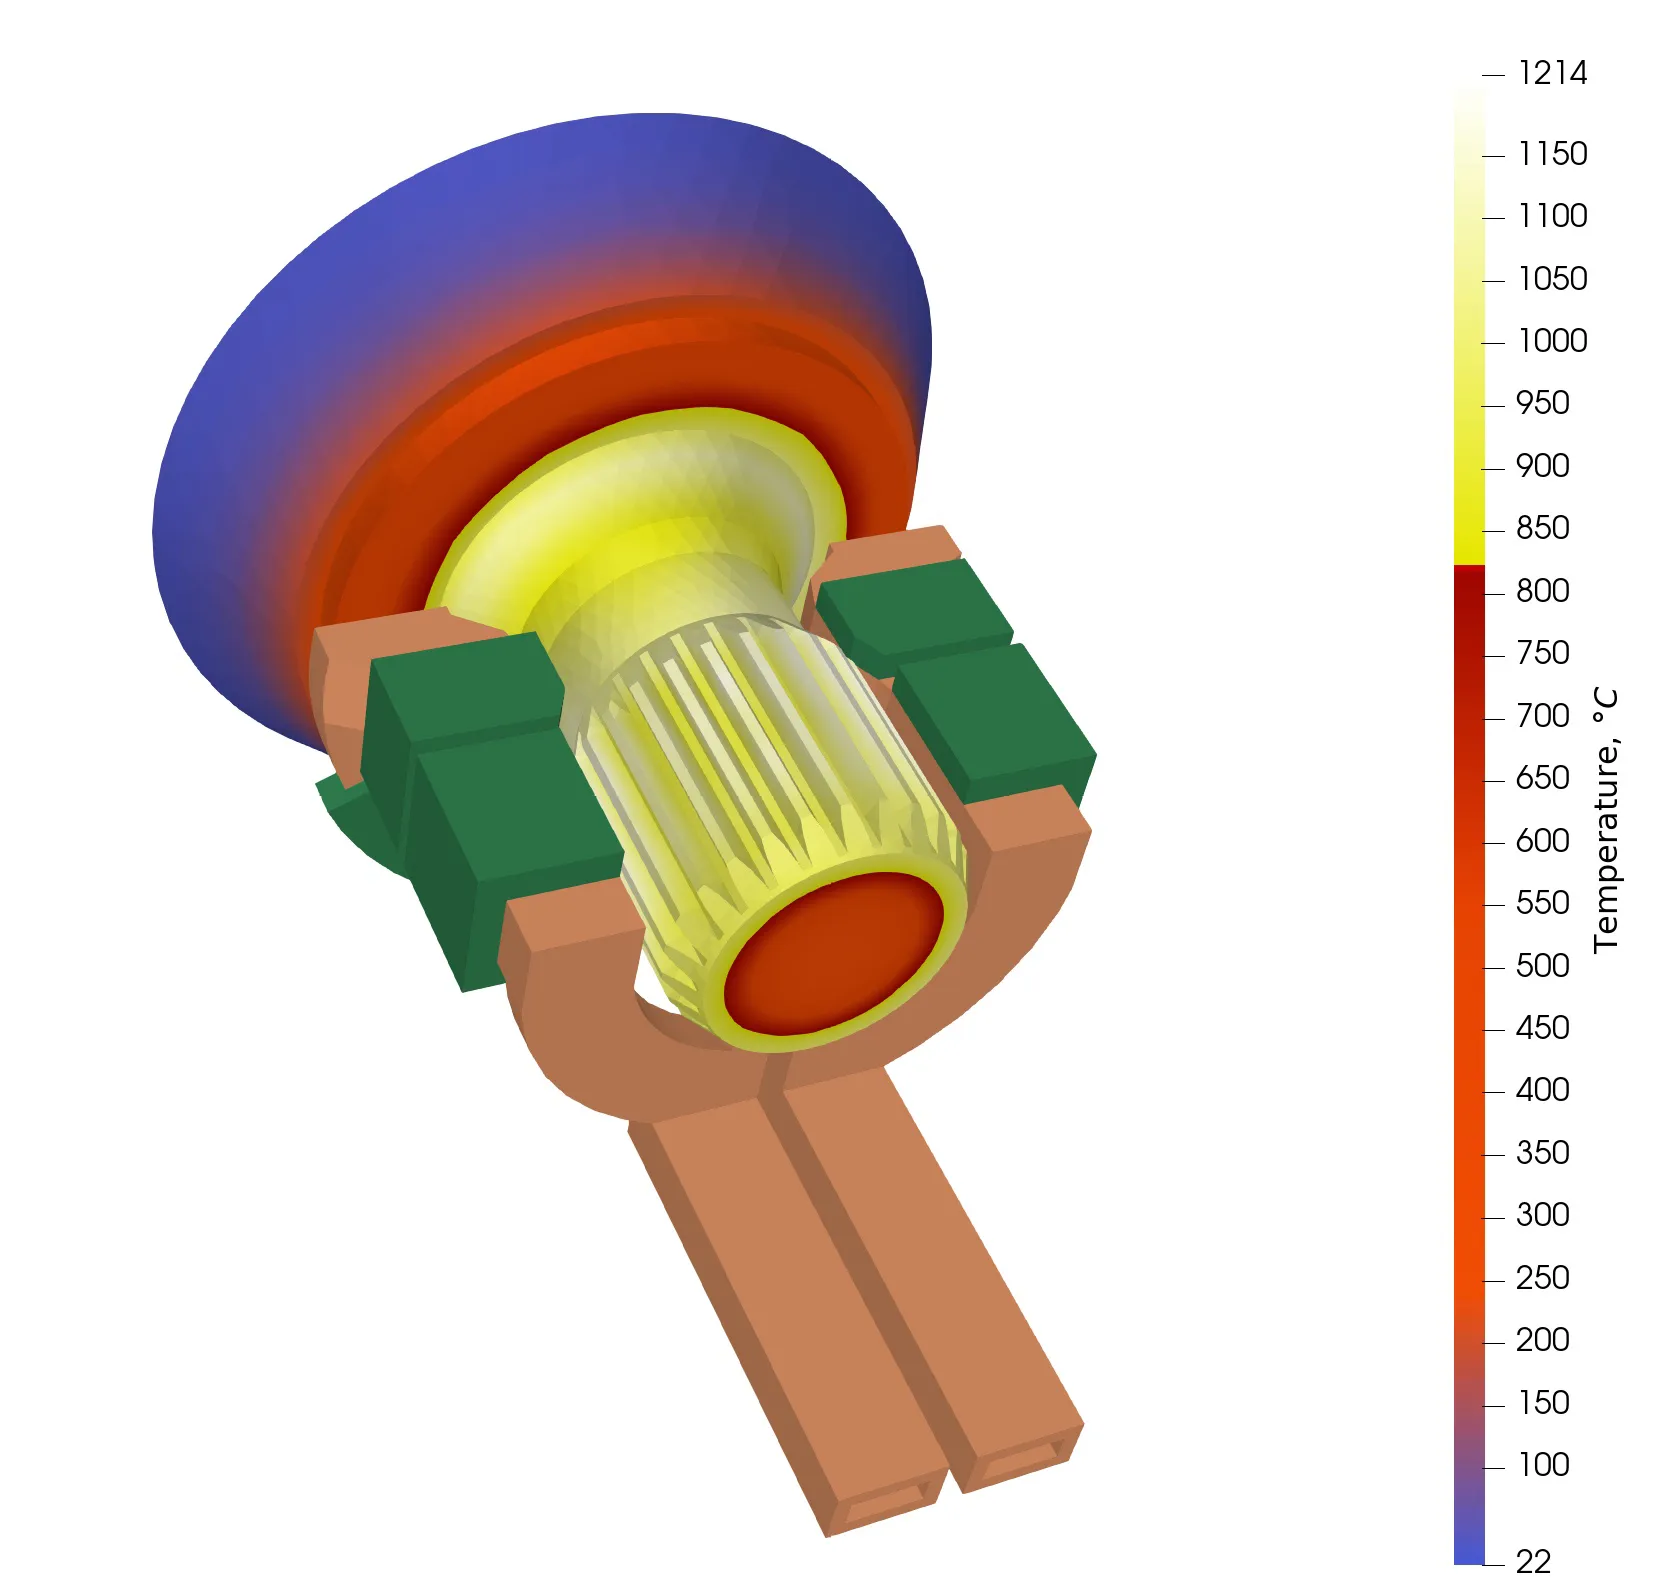
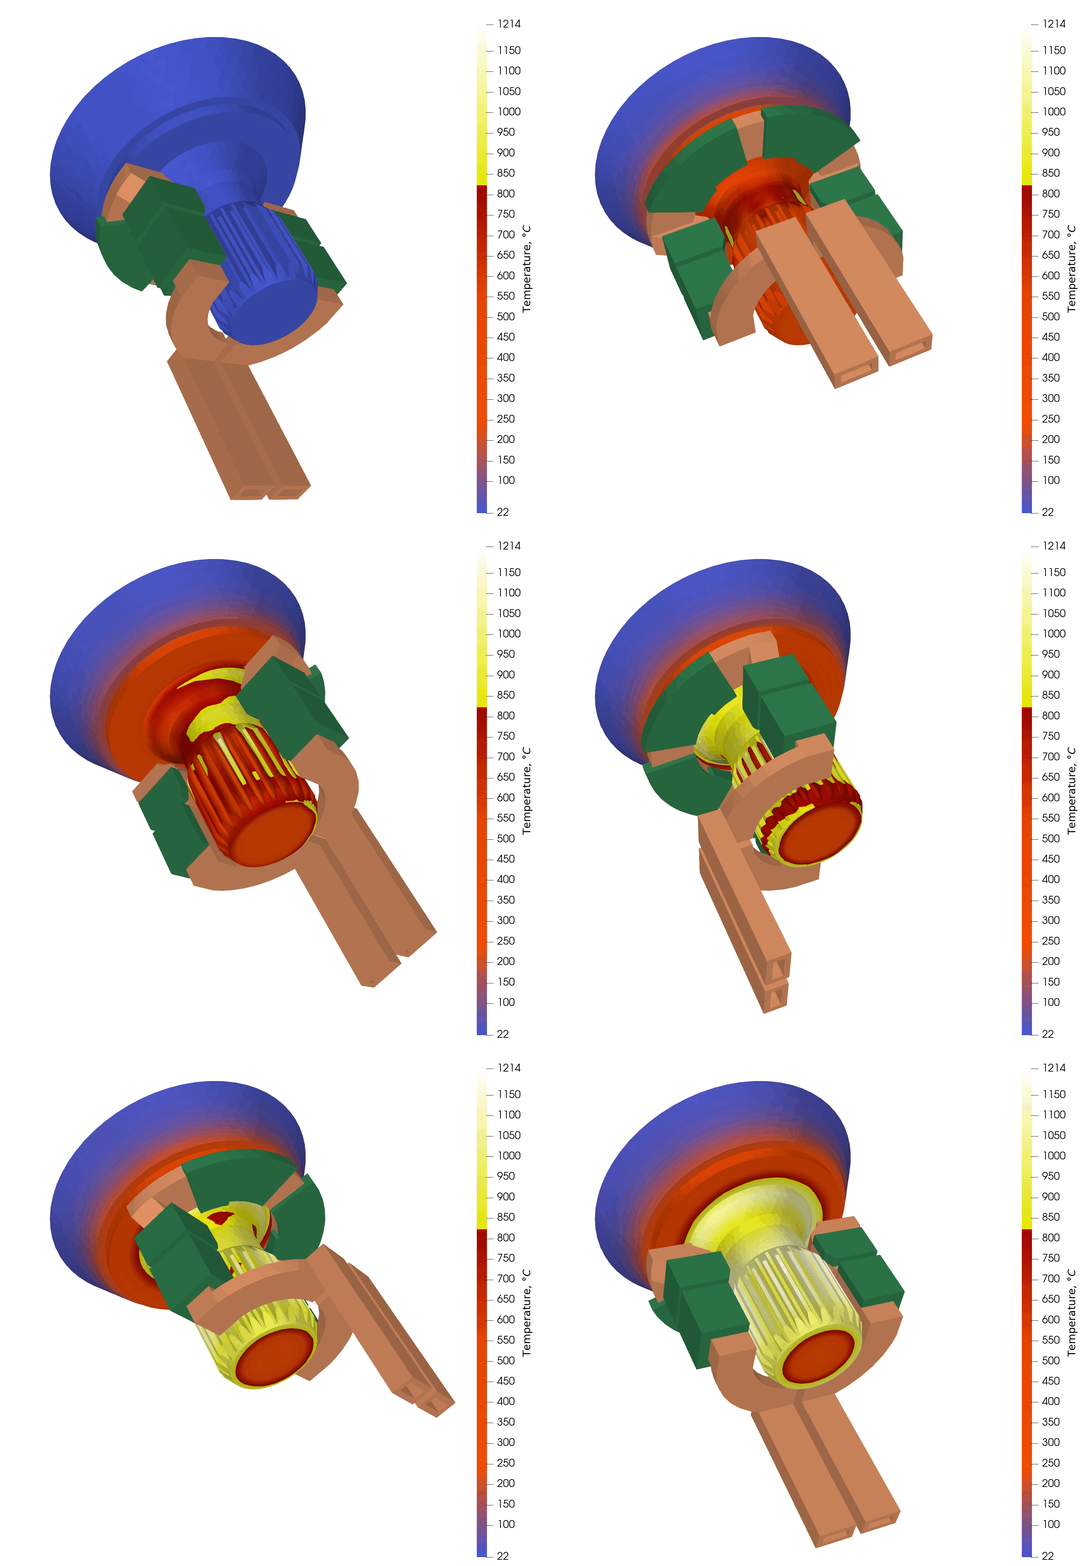
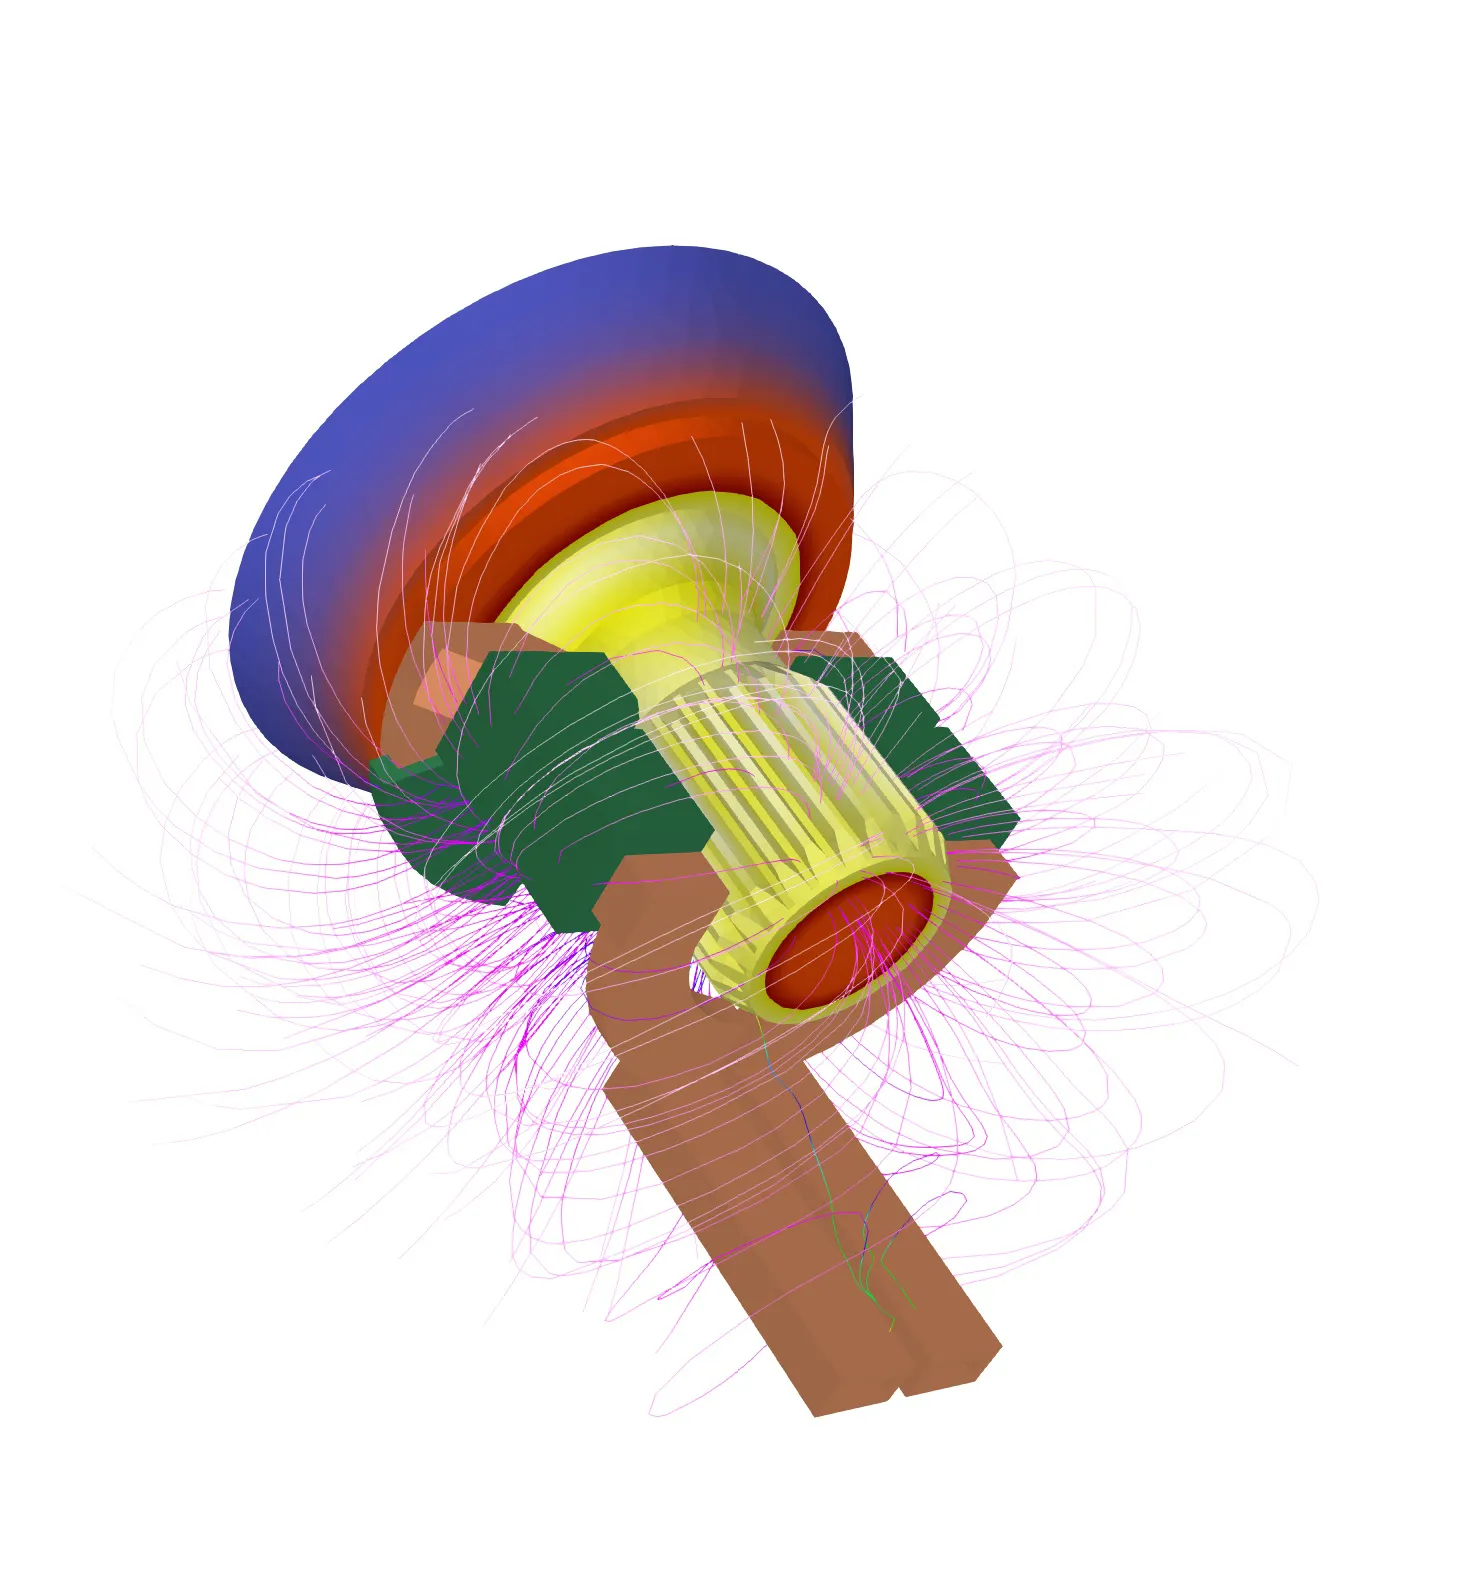
In these two images, we see a detailed 3D simulation of a CV joint undergoing the single-shot hardening process. The red, and orange areas represent the high temperatures the part reaches during heating, with the color gradient indicating the temperature distribution. The bright yellow color indicates the area heated above the austenisation temperature. That means, after the quench cooling, this area with undergo martensitic transformation, which results in the hardened case.
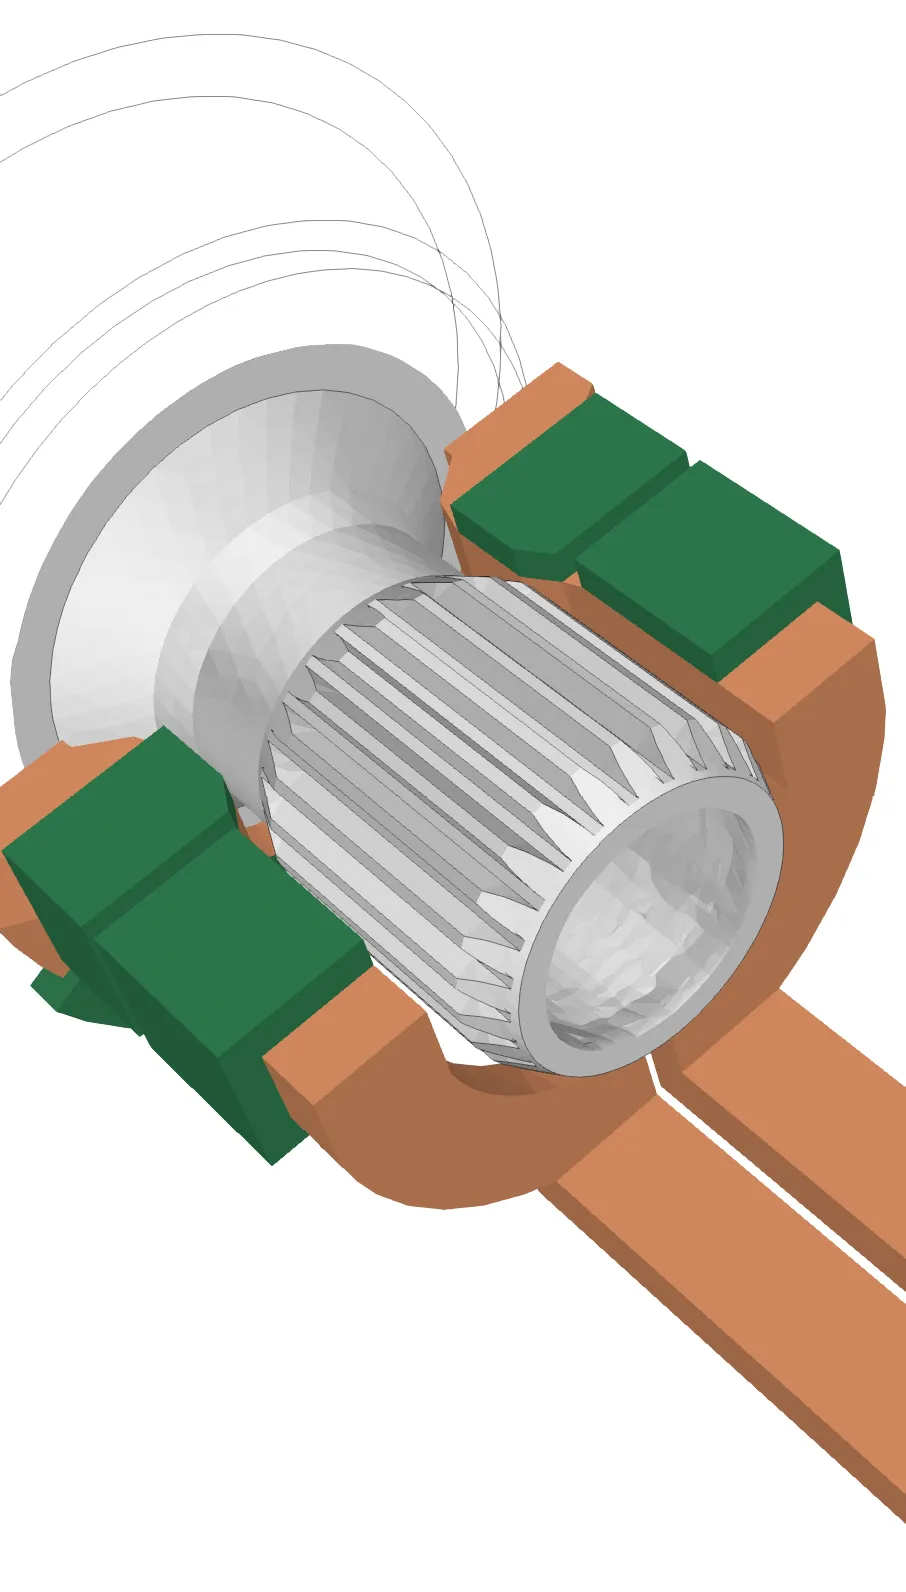
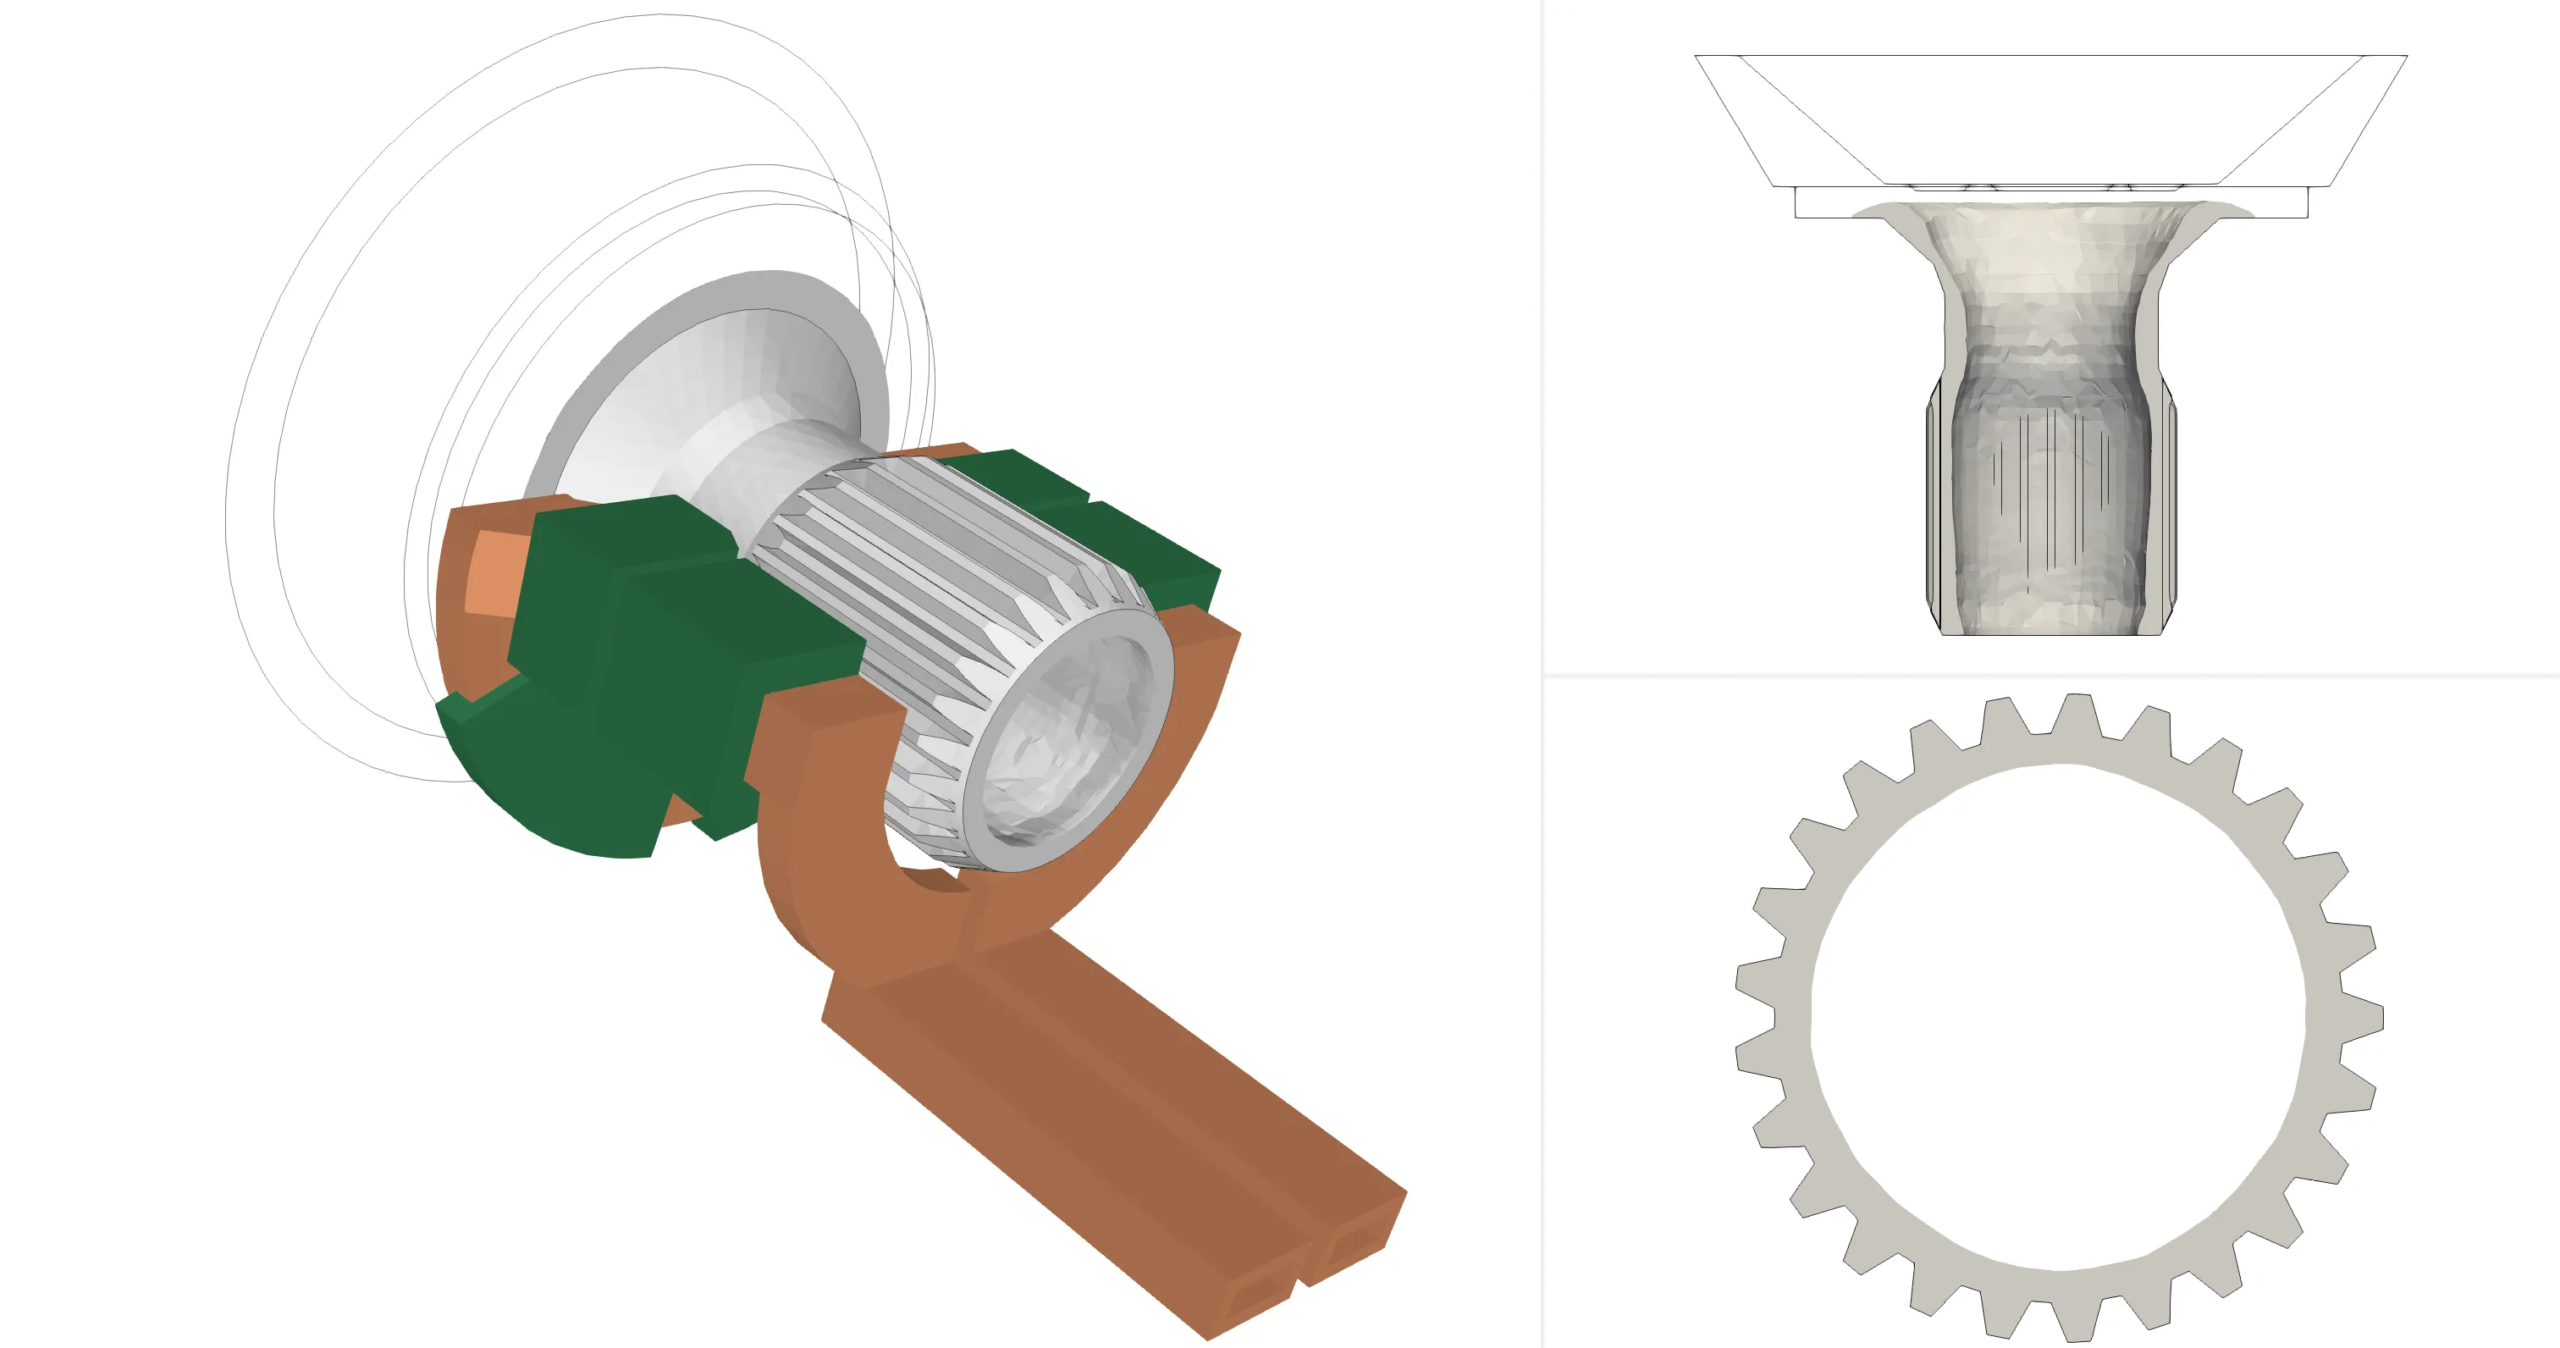
You’ll notice that the inductor, colored in brown, surrounds the joint, directing the heat precisely to the necessary areas. The flux concentrators, in green, concentrates the magnetic field, which cause higher current density and, consequently, more heat.
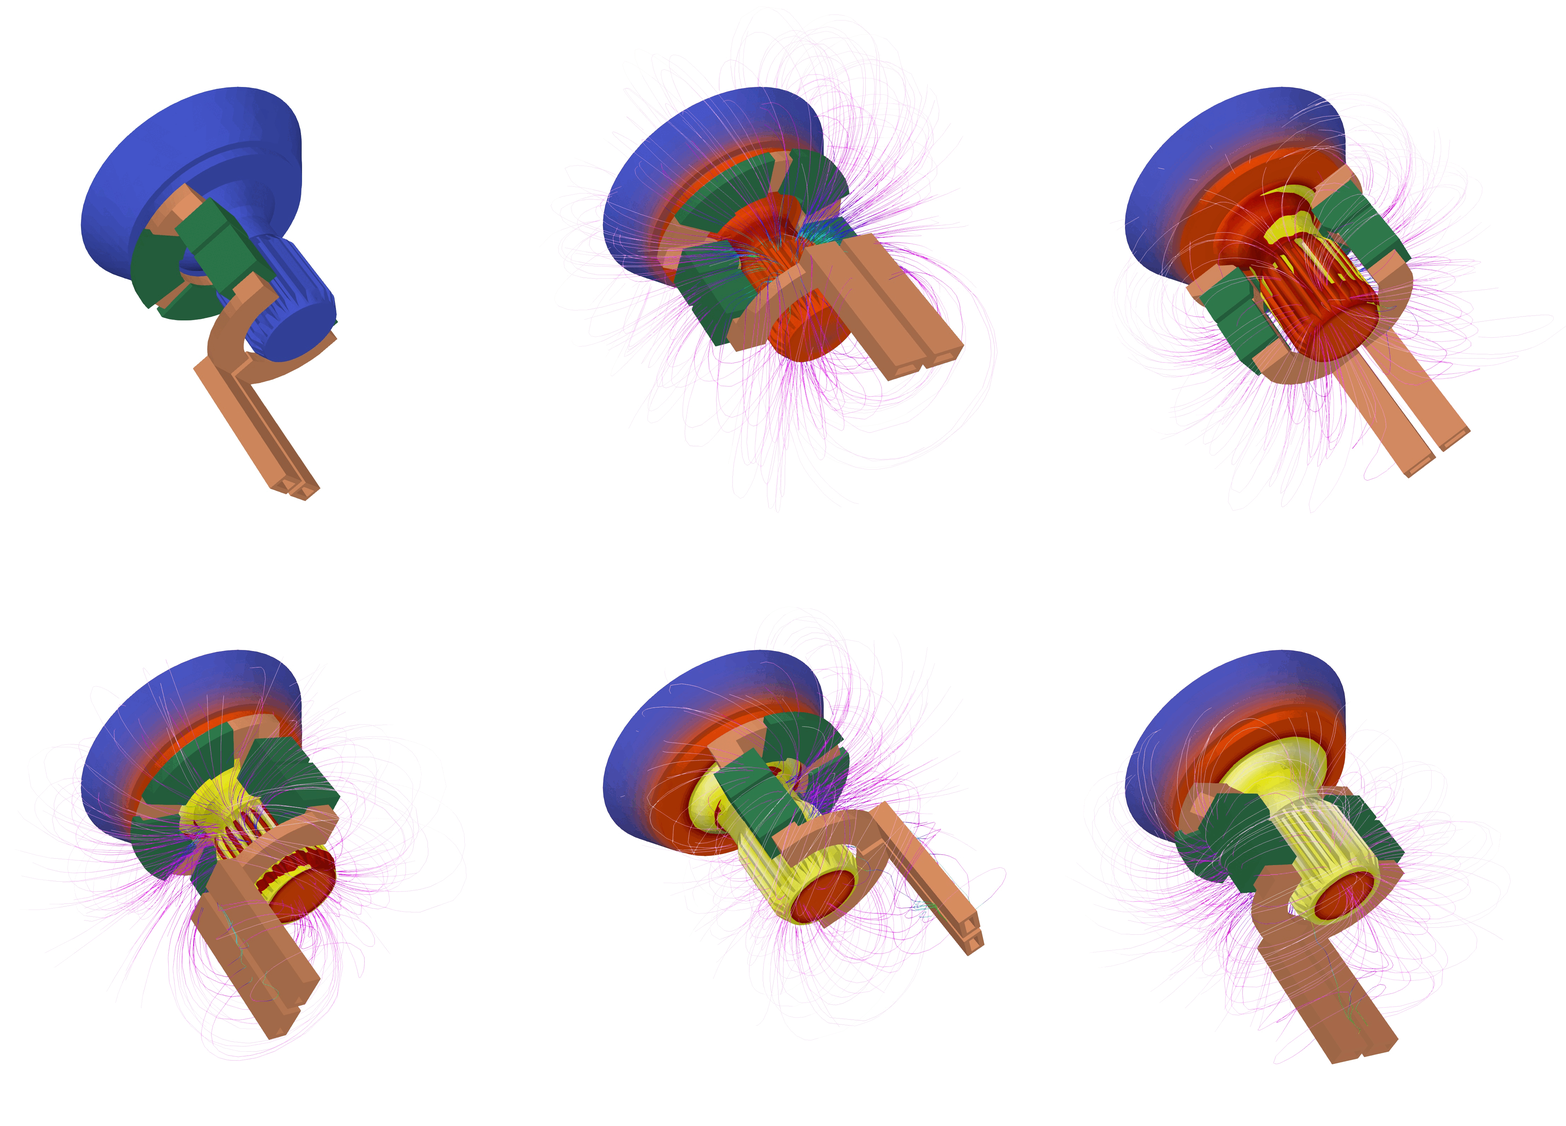
Simulation of the CV joint hardening process:
In this specific simulation, the inductor is moving while the workpiece (the CV joint) remains stationary. This setup is flexible and can be adjusted depending on preferences. Usually, in real-world applications, engineers prefer to keep the inductor still while the workpiece rotates. Both options are possible and simulated in CENOS, allowing engineers to experiment and identify the best approach for their specific application.
Cross-section of the heated CV joint:
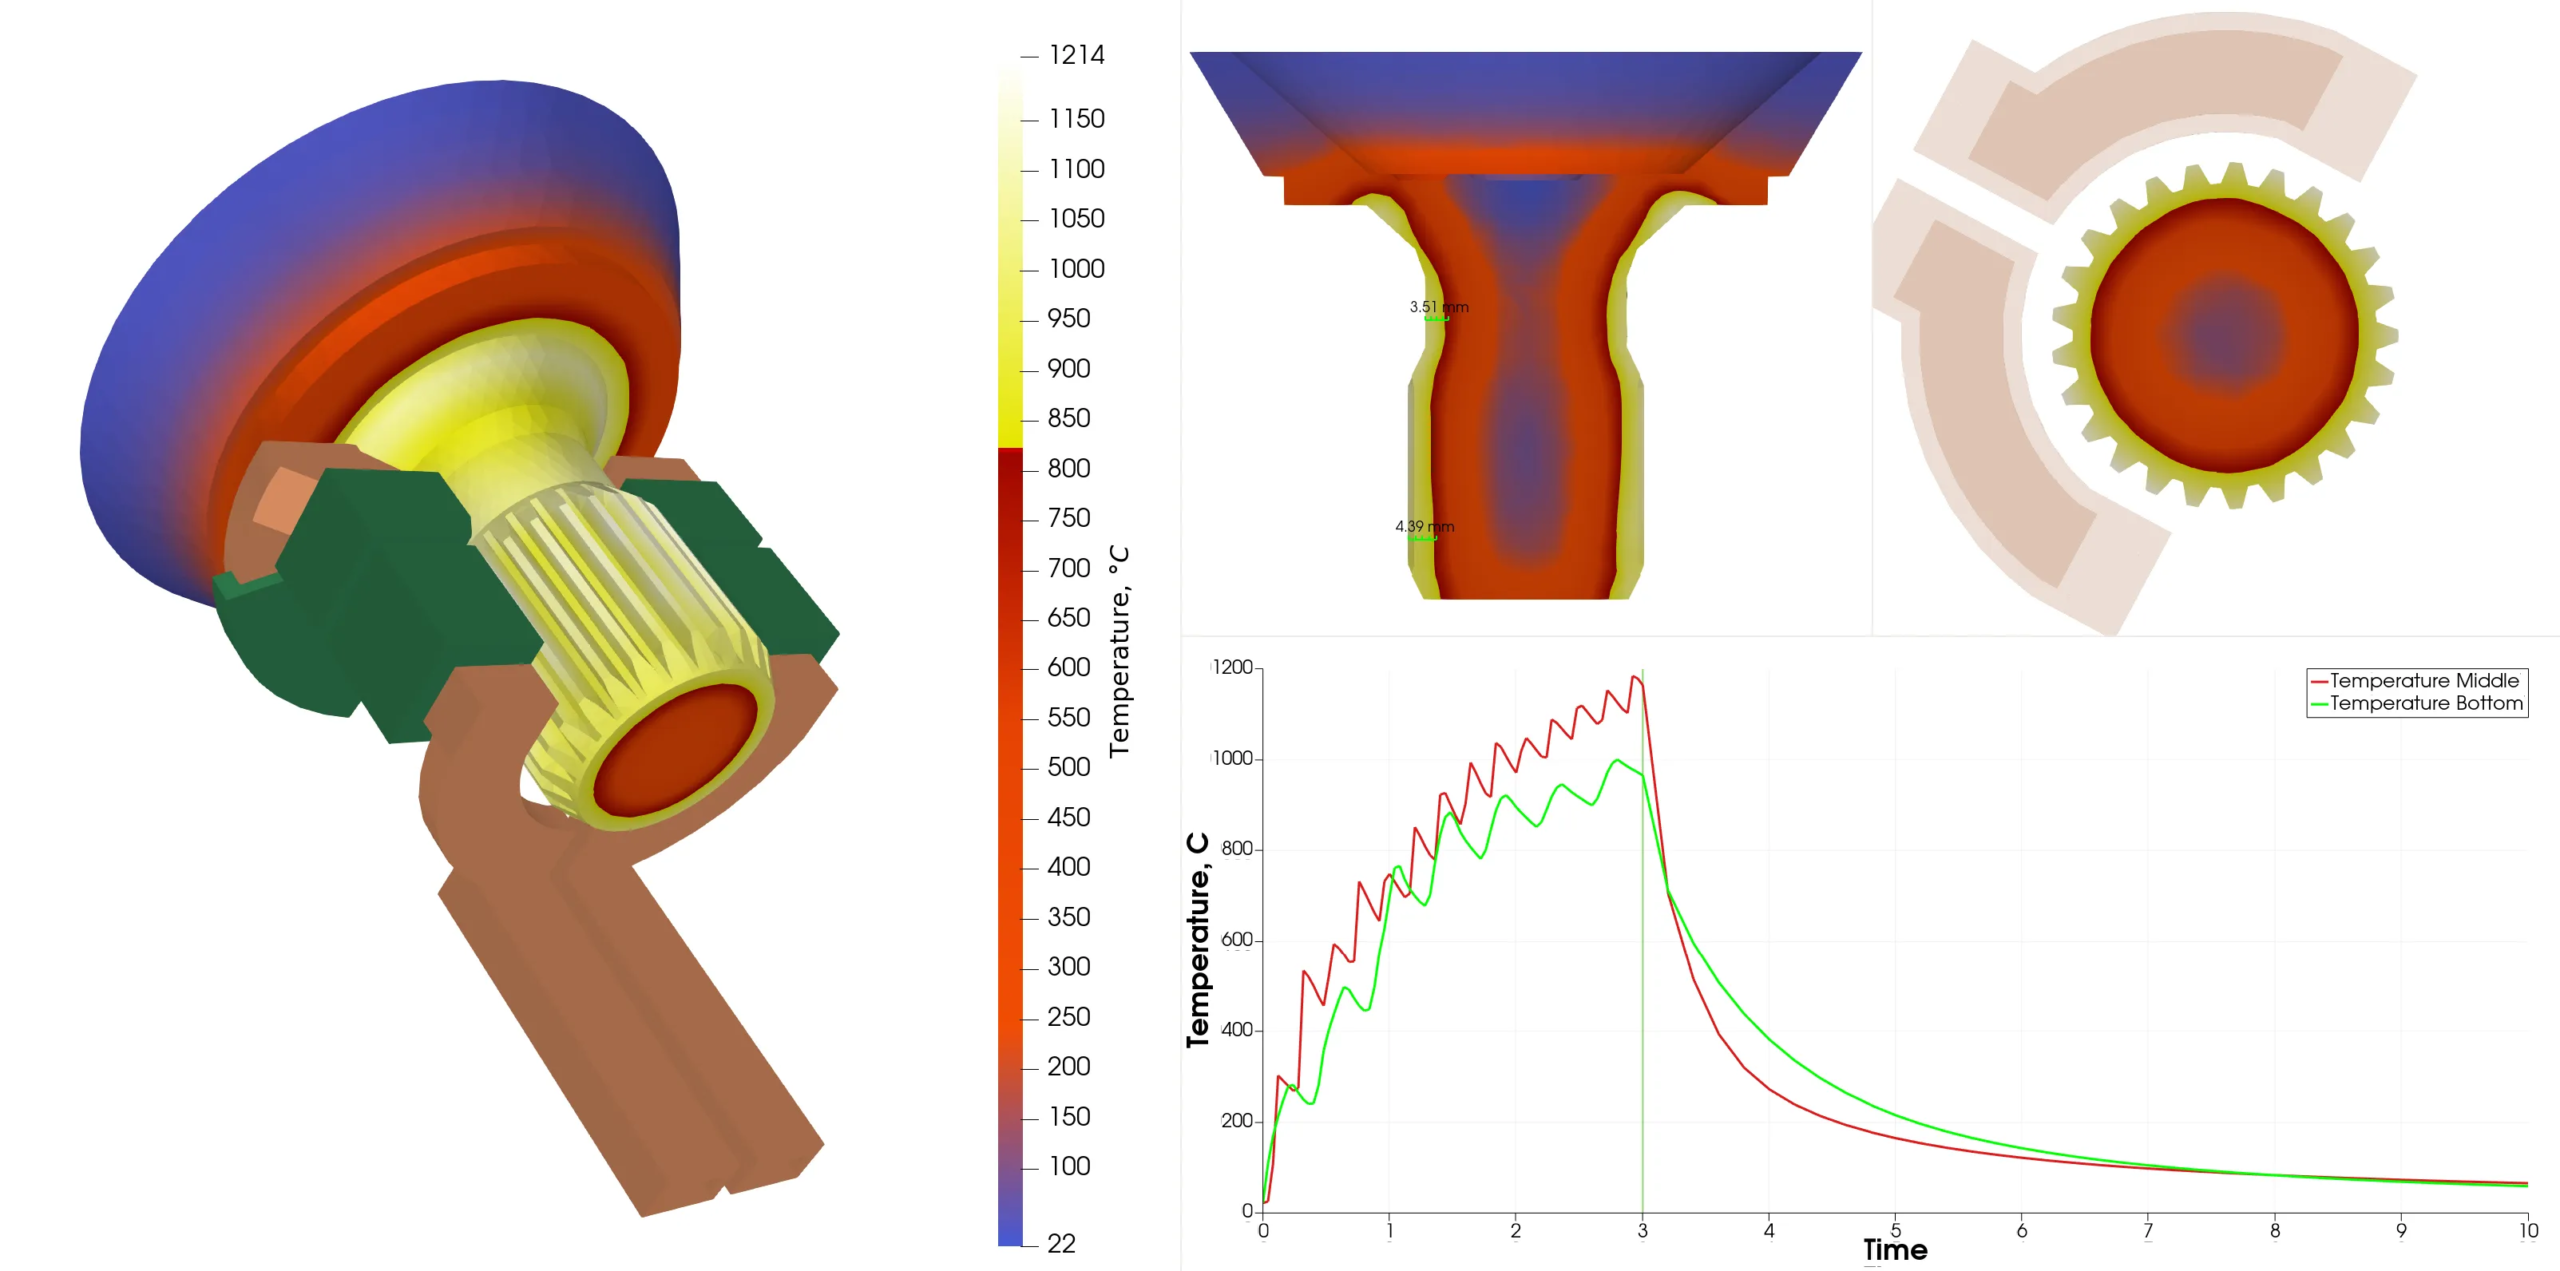
The cross-sectional view reveals the temperature gradient through the joint. Notice the red-hot core where the heat concentration is high and becoming very high in the outer yellow layers. The goal is to get this yellow zone where it is necessary according to the specification – not more, not less. The yellow zone represents the zone where temperature achieved the austenization point, so it will get hardened upon quench cooling. Simulation software allows the measurement of the hardened zone in the cross-section actually without cutting the part.
Top view of the CV joint with flux concentrators:
Flux concentrators are critical in focusing the magnetic field generated by the inductor. This ensures that the energy is not wasted and is directed exactly where it’s needed, making the process energy-efficient. We can see that the heat is most concentrated around the teeth of the splines.
The graph below shows the temperature variation at two critical points on the CV joint. The sharp rise in temperature indicates how quickly the metal heats up during the induction process, reaching over 1000°C within seconds.
Engineers typically spend weeks designing and refining inductors, running multiple physical tests before arriving at an optimal design. But with CENOS simulation software, what once took weeks now takes a few hours or a day. Engineers can visualize the heat distribution, adjust the inductor design, and simulate different setups, eliminating costly prototyping and trial-and-error approaches.
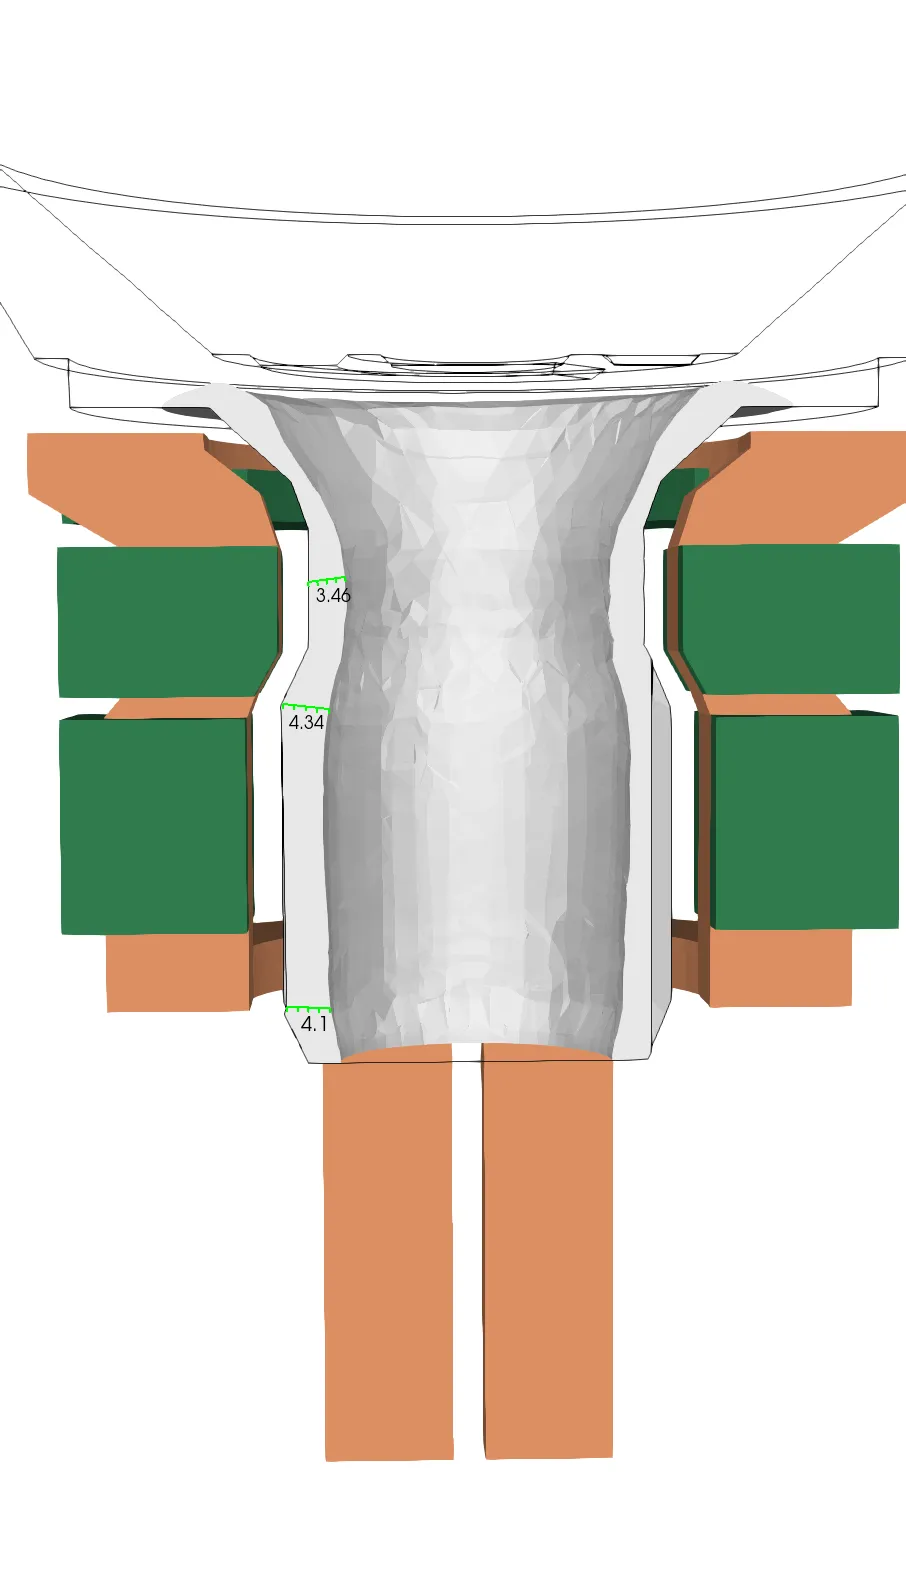
Cross-sectional view of the CV joint with hardened thickness:
This image provides a cross-sectional view of the CV joint, clearly showing how the heat has penetrated into the metal. The values in bright green (3.46 mm, 4.34 mm, 4.1 mm) show the thickness of the hardened layer in different parts of the joint.
The splined area of the CV joint has a hardened layer approximately 4.34 mm thick, improving durability in the region that has the most mechanical stress.
The values indicate that different sections of the joint receive different degrees of hardening, based on their functional requirements. For example, the central region of the joint has a slightly thinner hardened layer (3.46 mm), likely due to its different stress profile compared to the splined section.
The hardened layer is most concentrated around the teeth of the splines, which is expected since this area gets the most friction and mechanical load. The even distribution of the hardened layer makes sure that no weak spots exist, which would otherwise lead to material fatigue and potential failure over time.
Visualization of magnetic fields in single-shot hardening:
The electromagnetic field lines (seen in purple and white) visually represent how the magnetic field interacts with the metal surface. The flux concentrator, shown in green, is the source of these field lines, which wrap around the surface of the joint.
The temperature gradient on the CV joint is also clearly visible, with the highest temperatures concentrated near the outer edge, indicated by the bright red and yellow areas. This is where the material is being hardened the most, as the induction heating raises the temperature to the necessary hardening level.
The flux concentrators, also shown here, help channel the electromagnetic energy into the desired areas, reducing the risk of energy loss and focusing the heating on critical parts of the joint.
3D view of the inductor and current density:
Here we can see a 3D visualization of the inductor surrounding the CV joint with the current density distribution across the inductor and the joint. The color gradient—from blue to red—indicates the intensity of the current density, with blue representing lower values and red representing higher values.
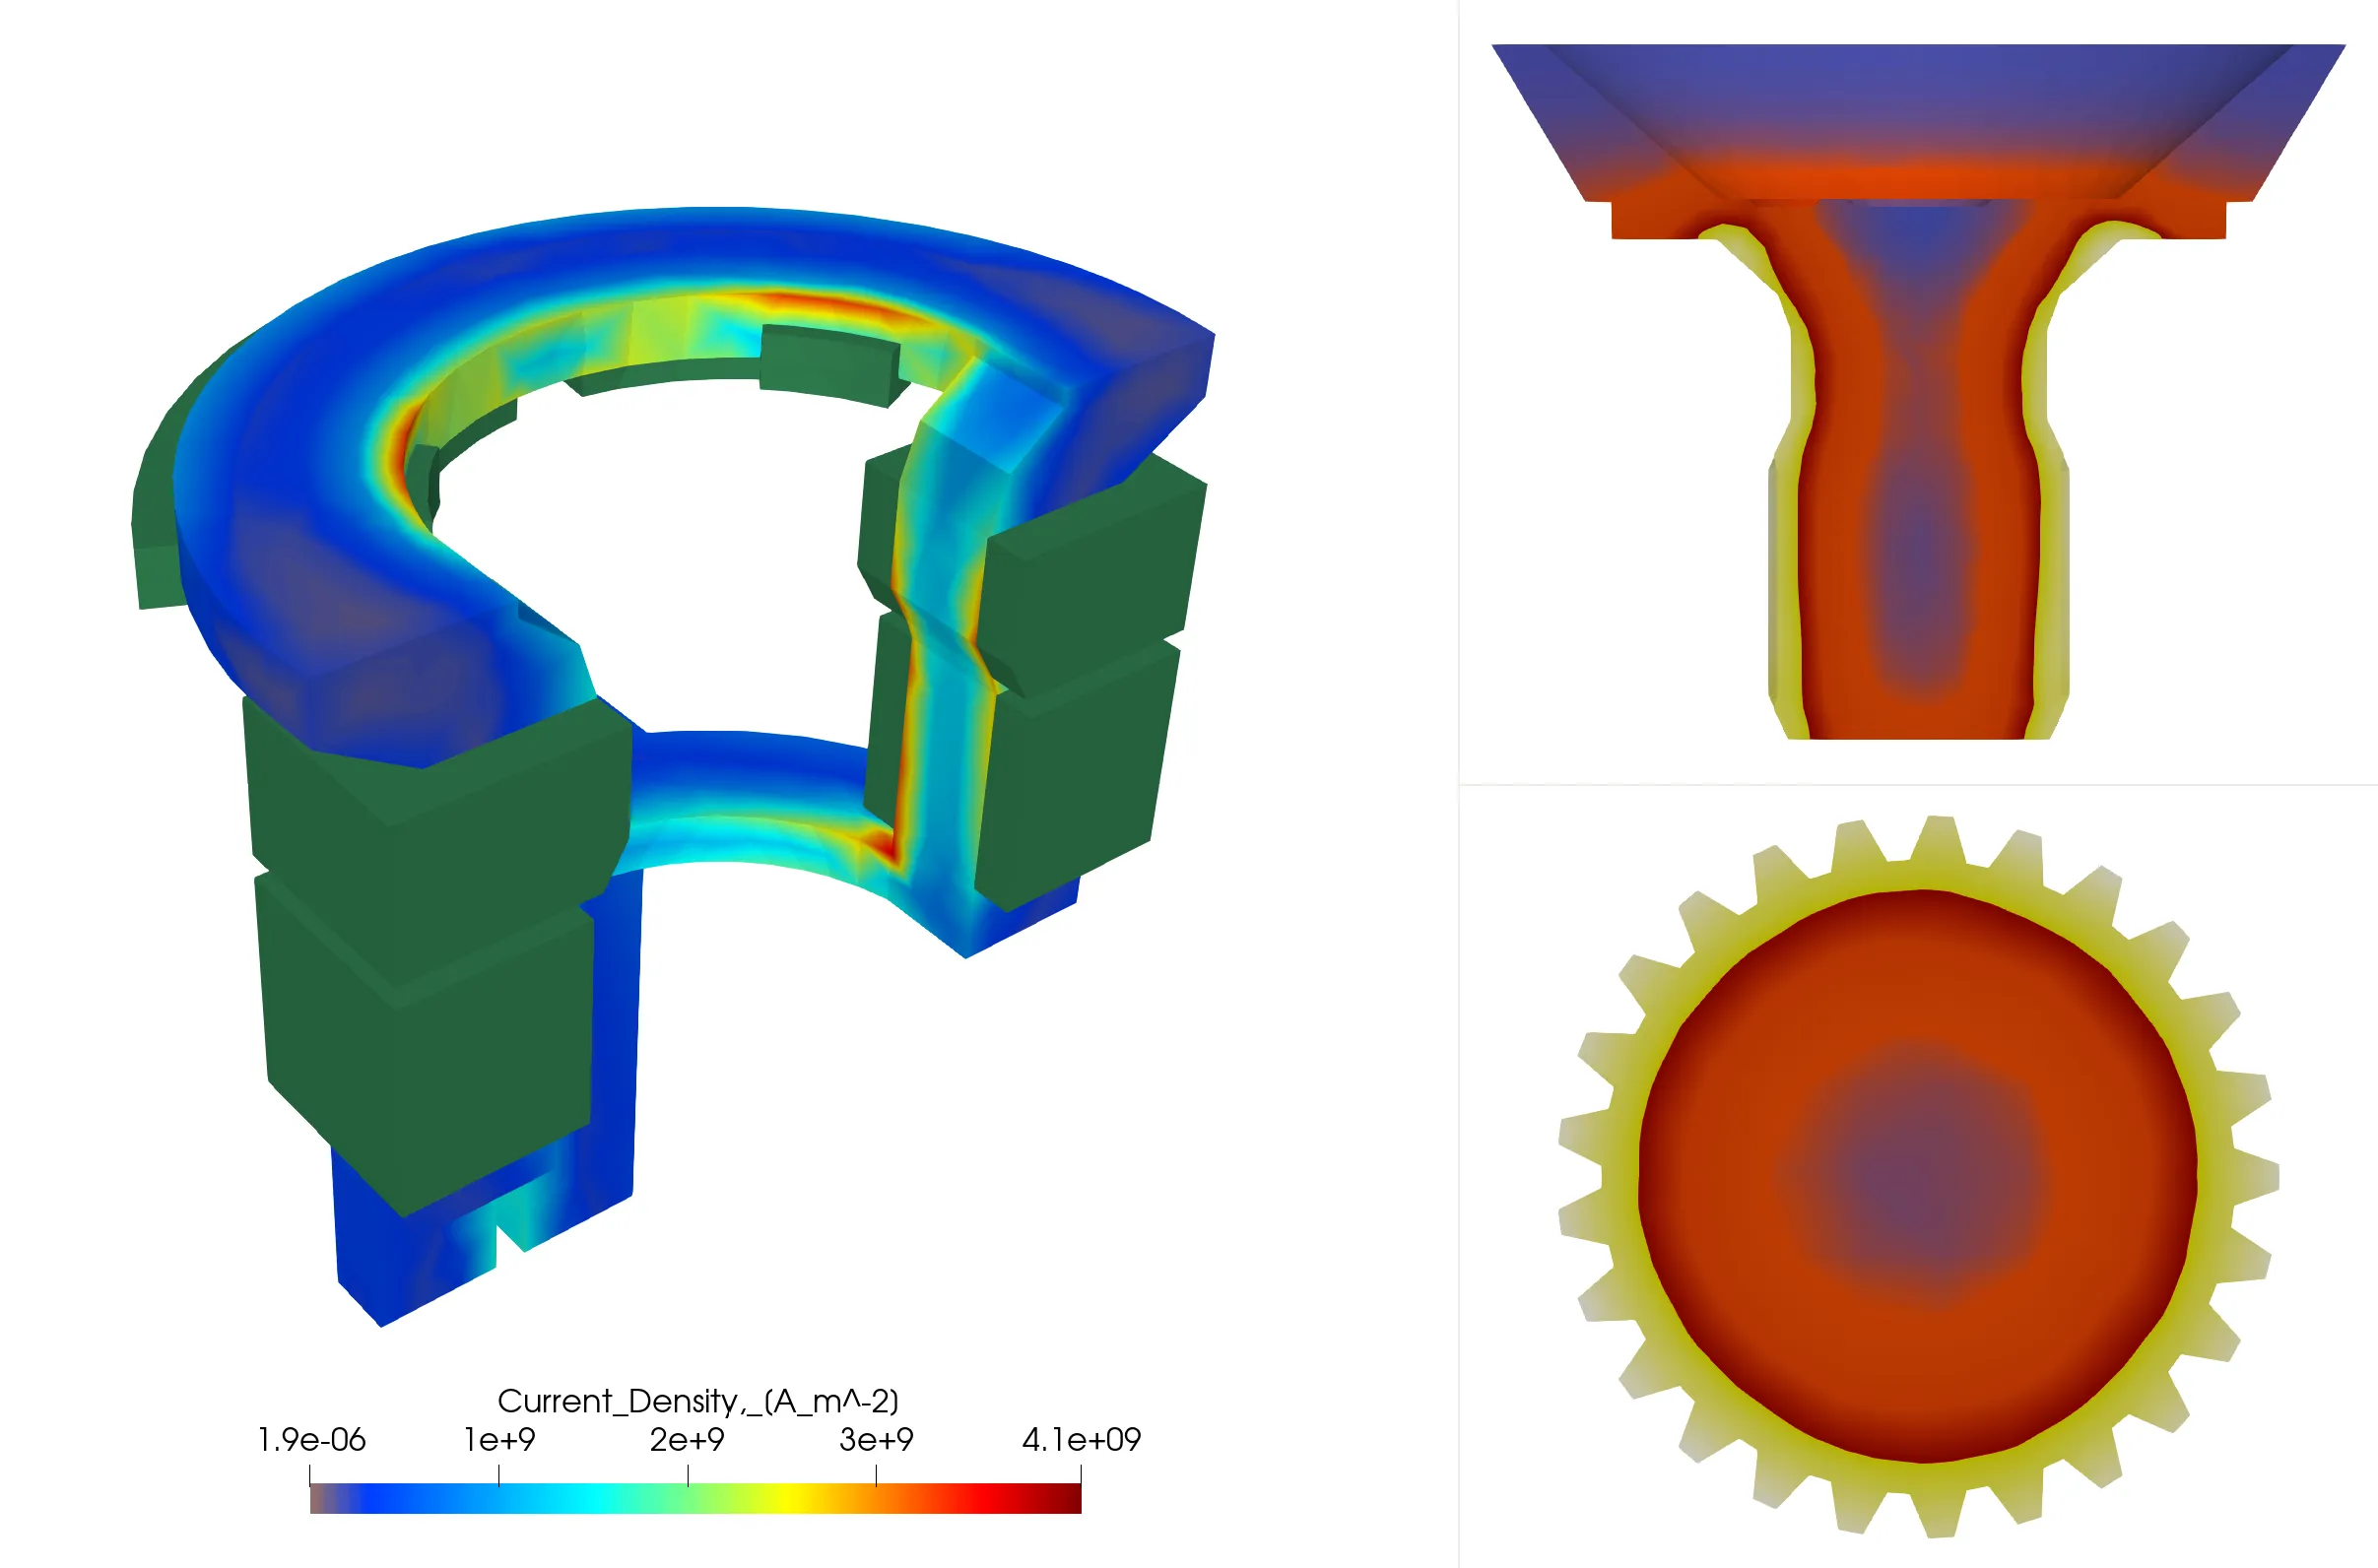
The area where the current density is highest (represented by the red and orange regions) shows where the temperature is highest. This will directly impact how efficiently the CV joint is heated. The goal is to achieve optimal heating in the most critical areas of the CV joint, particularly around the splines.
In this cross-sectional image the temperature gradient reveals how deeply the heat has penetrated into the material. Engineers use this cross-sectional view to ensure that the joint is hardened to the appropriate depth, making sure the high-stress areas (like the splines) are sufficiently treated.
This top view provides a look at the surface temperature distribution across the splined region of the CV joint.
What is the result?
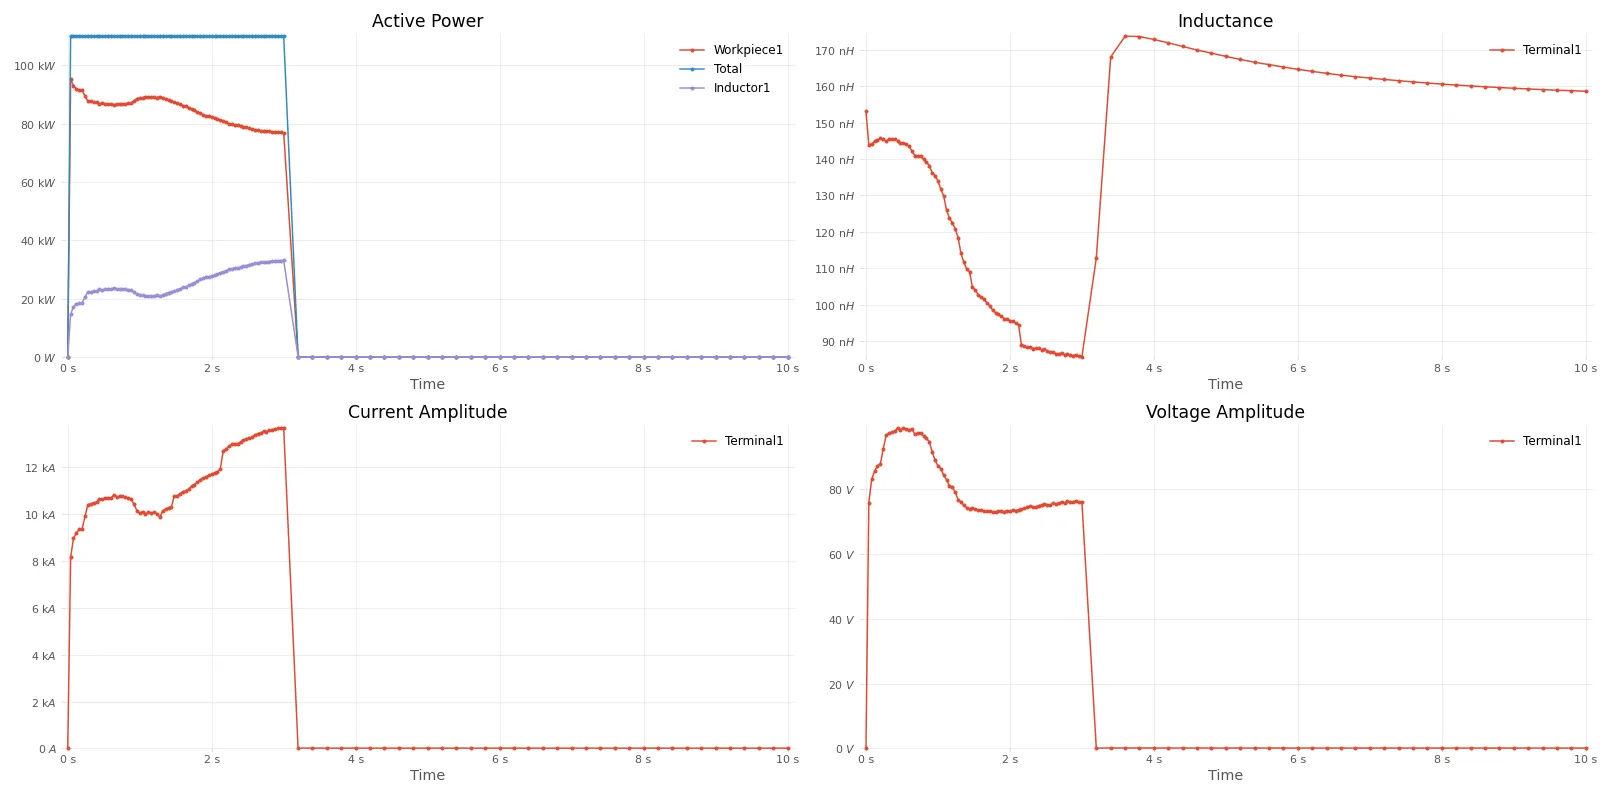
The set of graphs provides a detailed breakdown of the induction heating process.
- Active power: This graph shows the power being delivered to both the workpiece and the inductor. The power ramps up quickly and remains stable throughout the process, ensuring consistent heating.
- Inductance: The inductance increases sharply at the start of the process, then stabilizes as the CV joint reaches the desired temperature. The red line is the power in the workpiece, while the purple line is the power in the inductor. Their sum remains constant – it’s total power. The power in the inductor is lost. So, it is to maximize the power fraction to the workpiece.
- Current amplitude: The current amplitude rises steadily at the start of the process and remains stable. The power supply delivers constant power (total power). The power is a multiplication of current and voltage. While power remains constant, the actual distribution of current and voltage may fluctuate. So, the software shows them.
- Voltage amplitude: The voltage remains stable throughout the process, which is crucial for maintaining consistent power delivery to the inductor.
Why is this simulation important for engineers?
Using CENOS simulation software, engineers can overcome the challenges of single-shot hardening by optimizing the inductor and flux concentrator designs in a virtual environment. This eliminates the need for time-consuming and costly physical prototypes. The simulation provides feedback on how changes to the design will affect the heating process, allowing engineers to fine-tune the system quickly and efficiently.
The results speak for themselves: optimized current density, uniform temperature distribution, and stable power, inductance, and current throughout the process. Engineers can achieve the precision and consistency required for the hardening of complex components like CV joints without the trial-and-error typically associated with traditional methods.

