3D simulation of an SMD inductor / DC choke
SMD inductors and DC chokes are widely used in power electronics. They help store energy, reduce electrical noise, and keep voltage stable. When designing these components, engineers need to consider heat buildup, current flow, and magnetic field behavior. A well-designed inductor lasts longer, wastes less energy, and works more efficiently.
This case study uses 3D simulation to analyze an SMD inductor and see how it handles heat, current, and magnetism. These simulations help engineers spot problems early, improve designs, and reduce costs before making physical prototypes. Below, we break down the key findings from the simulation.
Here’s a detailed breakdown of the simulation.
Temperature distribution

- What’s shown:
- This simulation illustrates the temperature distribution across the SMD inductor/DC choke.
- The color scale (ranging from blue to red) indicates the temperature magnitude, where blue represents lower temperatures (around 21°C) and red represents higher temperatures (up to 28°C).
- The heat is most concentrated around the center of the inductor coil, indicating where energy dissipation and thermal buildup occur due to resistive heating.
- Insights for engineers:
- These results can guide thermal management strategies, such as optimizing airflow or adding heat-dissipating materials.
- The temperature range provides a benchmark for material selection to ensure reliability under operating conditions.
Current density visualization
- What’s shown:
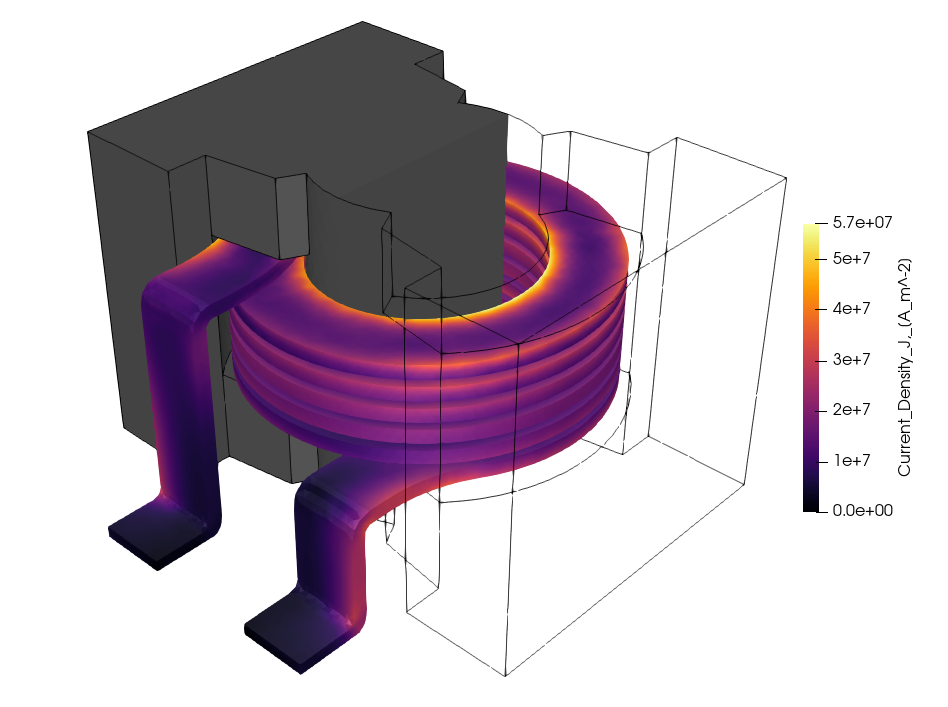
- This simulation displays the current density (J, in A/m²) across the inductor’s structure.
- The color gradient (from black to yellow) represents the density of the current, with yellow showing the maximum value of approximately 5.7 x 10⁷ A/m².
- The highest current density appears along the inner turns of the coil and the contact points of the legs, indicating regions of maximum electrical activity.
- Insights for engineers:
- These data highlight areas prone to higher power loss due to resistance (Joule heating).
- Engineers can use this visualization to improve design for uniform current distribution, reducing localized heating and improving overall efficiency.
Physical prototype
- What’s shown:
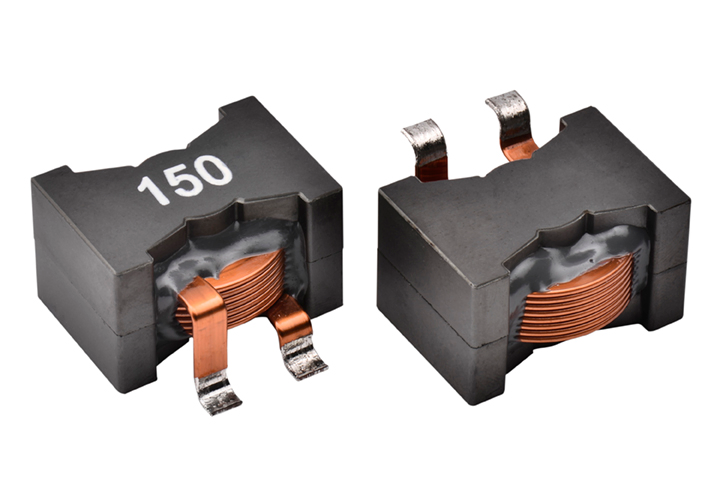
- A physical SMD inductor/DC choke prototype, showing the actual structure, including the core material, copper windings, and terminal legs.
- The stamped number (150) on the package likely denotes the inductance value (e.g., 150 µH).
- Insights for engineers:
- This image ties the simulation to real-world hardware, confirming the practical implications of the simulated results.
- The construction quality, winding tightness, and material composition seen here can be evaluated for performance comparisons.
Magnetic field distribution
- What’s shown:
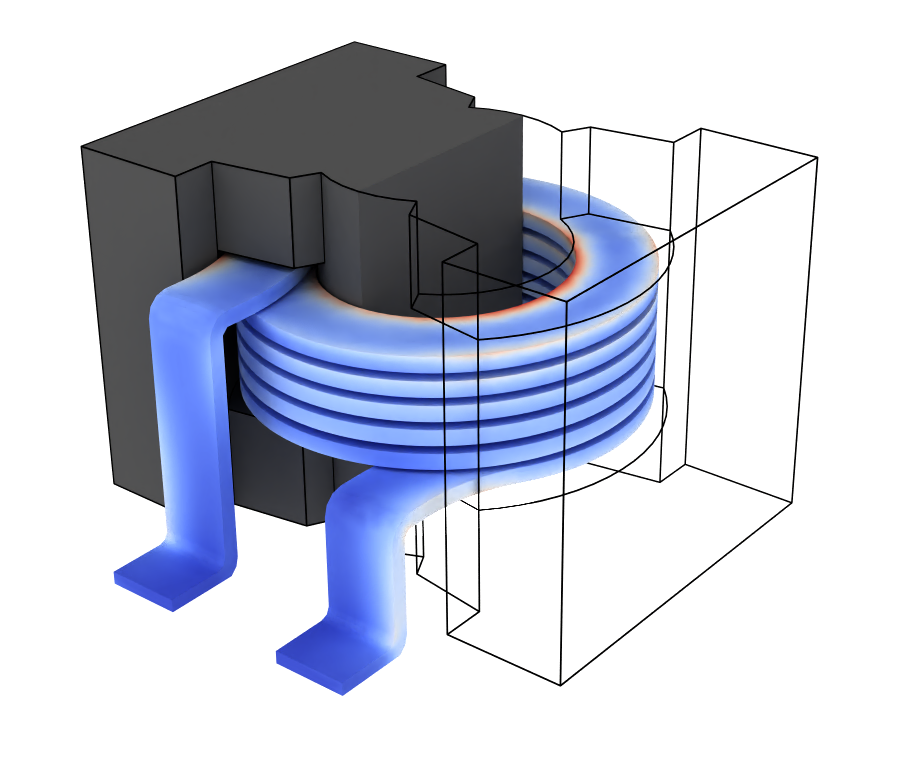
- This simulation visualizes the magnetic field distribution around the inductor.
- The color intensity (from light blue to orange) represents the magnetic flux density (B-field), with areas near the windings and the core showing the strongest fields.
- Insights for engineers:
- Engineers can use these insights to minimize stray fields that could interfere with nearby components.
- The uniformity of the magnetic field indicates effective magnetic coupling, which is critical for maintaining inductance efficiency.
Summary
- Thermal analysis:
- Maximum temperature: 28°C at the coil center.
- Guide for improving thermal dissipation mechanisms.
- Current distribution:
- Peak current density: 5.7 x 10⁷ A/m².
- Suggests areas to reinforce conductivity and reduce resistive losses.
- Magnetic behavior:
- High flux density localized to the windings and core.
- Optimization opportunities in field containment to reduce electromagnetic interference.
- Real-world correlation:
- Physical prototype verifies the practical relevance of simulation results.
- Material choice and structural design validated against operational parameters.
This case study shows how 3D simulation helps engineers improve inductor design by revealing heat buildup, current flow, and magnetic field behavior before production. Using these tools, engineers can reduce energy loss, improve efficiency, and avoid costly mistakes.
Better simulations lead to better designs, making inductors that last longer and perform well in real applications.
